Posts Tagged echonest
Tracking play coverage in the Infinite Jukebox
Yesterday, I upgraded the Infinite Jukebox to make it less likely that it would get stuck in a section of the song. As part of this work, I needed an easy way to see the play coverage in the song. To do so, I updated the Infinite Jukebox visualization so that it directly shows play coverage. With this update, the height of any beat in the visualization is proportional to how often that beat has been played relative to the other beats in the song. Beats that have been played more have taller bars in the visualization.
This makes it easy to see if we’ve improved play coverage. For example, here’s the visualization of Radiohead’s Karma Police with the old play algorithm after about an hour of play:
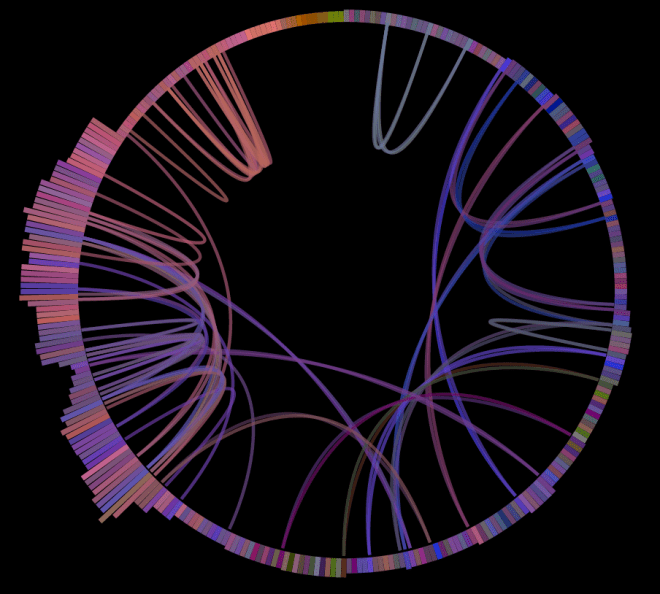
As you can see, there’s quite a bit of bunching up of plays in the third quarter of the song (from about 7 o’clock to 10 o’clock). Now compare that to the visualization of the new algorithm:
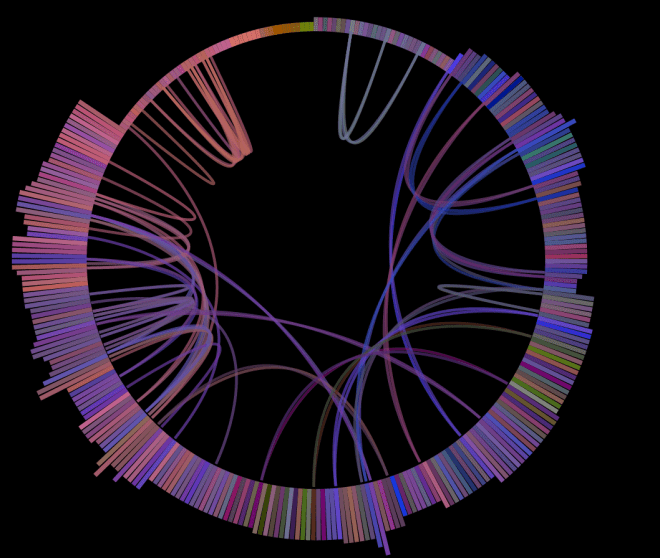
With the new algorithm, there’s much less bunching of play. Play is much more evenly distributed across the whole song.
Here’s another example. The song First of the Year (Equinox) by Skrillex played for about seven hours with the old algorithm:
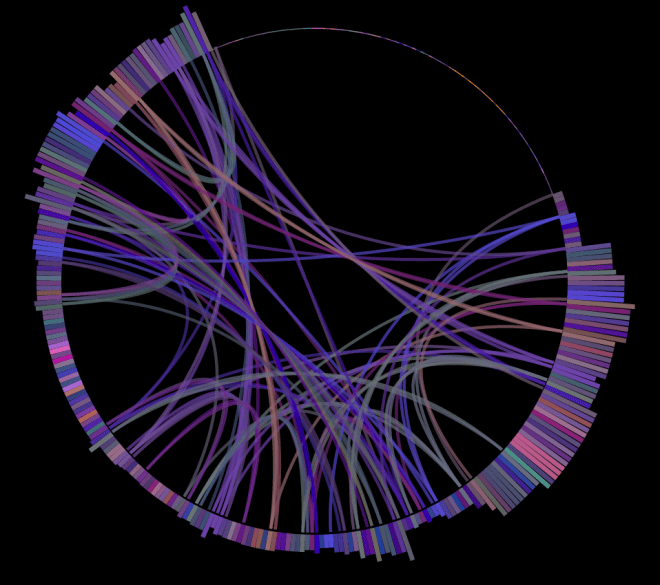
As you can see, it has quite uneven coverage. Note the intro and outro of the song are almost always the least played of any song, since those parts of the song typically have very little similarity with the rest of the song.
Here’s the same song with the new algorithm:
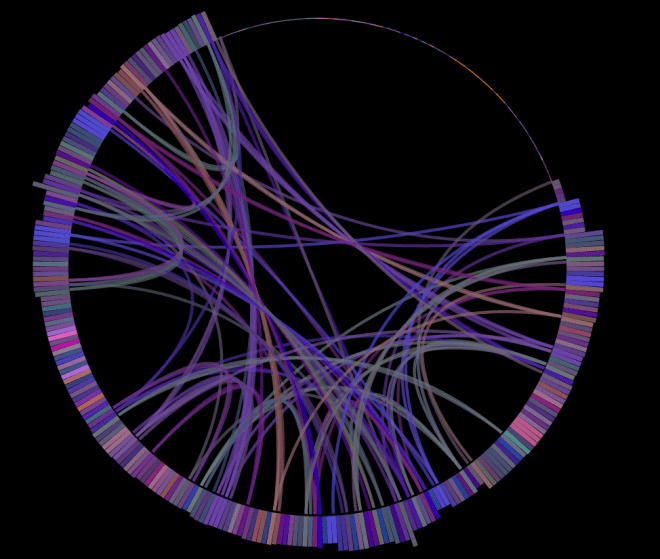
Again, play coverage is much more even across all of the song outside of the intro and the outro.
I like this play coverage visualization so much that I’ve now made it part of the standard Infinite Jukebox. Now as you play a song in the Jukebox, you’ll get to see the song coverage map as well. Give it a try and let me know what you think.
More on “Where’s the Drama?”
Posted by Paul in code, events, Music, music hack day, Spotify, The Echo Nest on September 8, 2014
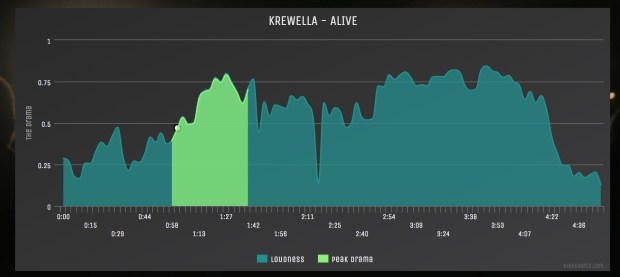
My Music Hack Day Berlin hack was “Where’s the Drama?” – a web app that automatically identifies the most dramatic moment in any song and plays it for you. I’ve been having lots of fun playing with it … and even though (or perhaps because) I know how it works, I’m often surprised at how well it does at finding the most dramatic moments. Here are some examples:
- When will the Bass Drop – Lonely Island
- Stairway to Heaven – Led Zeppelin
- Doomsday – Nero
- November Rain – Guns N Roses
How does it work? The app grabs the detailed audio analysis for the song from The Echo Nest. This includes a detailed loudness map of the song. This is the data I use to find the drama. To do so, I look for the part of the song with the largest rise in volume over the course of a 30 second window (longer songs can have a bit of a longer dramatic window). I give extra weight to crescendos that culminate in louder peaks (so if there are two crescendos that are 20dB in range but one ends at 5dB louder, it will win). Once I identify the most dynamic part of a song, I pad it a bit (so we get to hear a bit of the drop after the build).
The rest is just UI – the song gets plotted as a heavily filtered loudness curve with the dramatic passage highlighted. I plot things with Highcharts, which is a pretty nifty javascript plotting and charting library. I recommend.
Playing the music – I wanted to use Spotify to play the music, which was a bit problematic since there currently isn’t a way to play full streams with the Spotify Web API, so I did a couple of hacky hacks that got me pretty far. First of all, I discovered that you can add a time offset to a Spotify URI like so:
When this URI is opened in Spotify (even when opened via a browser), Spotify will start to play the song a the 1:05 time offset.
I still needed to be able to stop playing the track – and there’s no way to do that directly – so instead, I just open the URI:
which happens to be the URI for John Cage’s 4’33. In other words, to stop playing one track, I just start playing another (that happens to be silent). The awesome side effect of this is that I’ll be slowly turning anyone who uses “Where’s the Drama?” into experimental music listeners as the Spotify recommendation system responds to all of those John Cage ‘plays’. This should win some sort of ‘hackiest hack of the year’ award.
It was a fun hack to make, and great fun to demo. And now that I have the app, I am no longer wasting time listening to song intros and outros, I can just get to the bit of the song that matters the most.
Rock Steady – My Music Ed Hack
This weekend I’m at The Music Education Hack in New York City where educators and technologists are working together to transform music education in New York City. My hack, Rock Steady, is a drummer training app for the iPhone. You use the app to measure how well you can keep a steady beat. Here’s how it works:

First you add songs from your iTunes collection. The app will then use The Echo Nest to analyze the song and map out all of the beats. Once the song is ready you enter Rock Steady training mode: The app will show you the current tempo of the song. Your goal then is to match the tempo by using your phone as a drumstick and tapping out the beat. You are scored based upon how well you match the tempo. There are three modes: matching mode – in this easy-peesy mode you listen to the song and match the tempo. A bit harder is silent mode – you listen to the song for a few seconds and then try to maintain the tempo on your own. Finally there’s bonzo mode – here the music is playing, but instead of you matching the music, the music matches you. If you speed up, the music speeds up, if you slow down, the music slows down. This is the trickiest mode – you have to keep a steady beat and not be fooled by the band that is following you.
This is my first iOS hack. I got to use lots of new stuff, such as Core Motion to detect the beats. I stole lots of code from the iOS version of the Infinite Jukebox (all the track upload and analysis stuff). It was a fun hack to build. If anyone thinks it is interesting I may try to finish it and put it in the app store.
Here’s a video:
[youtube http://www.youtube.com/watch?v=UsJ7RBkRAag]
Joco vs. Glee
With all the controversy surrounding Glee’s ripoff of Jonathan Coulton’s Baby Got back I thought I would makes a remix that combines the two versions. The remix alternates between the two songs, beat by beat.
[audio http://static.echonest.com.s3.amazonaws.com/audio/combo.mp3]At first I thought I had a bug and only one of the two songs was making it into the output, but nope, they are both there. To prove it I made another version that alternates the same beat between the two songs – sort of a call and answer. You can hear the subtle differences, and yes, they are very subtle.
[audio http://static.echonest.com.s3.amazonaws.com/audio/combo-t1.mp3]The audio speaks for itself.
Here’s the code.
[gist https://gist.github.com/4632416]Bangarang Boomerang
Posted by Paul in code, fun, The Echo Nest on August 18, 2012

My latest music hack is Bangarang Boomerang. It is a web app (runs in Chrome or the latest Safari), that lets you ‘drive’ the Skrillex song. You can freeze-frame the song on a beat, you can make the song go backwards beat by beat, you can advance through the song at double time, or triple time, and set bookmarks to let you easily jump to different sections of the song. It is a rather fun app that lets you feel like a musician, even if you have very little musical talent.
Watch the quick Youtube demo, and then try it yourself: Bangarang Boomerang
[youtube http://youtu.be/GJQ1K1dnU2A]
Map of Music Styles
Posted by Paul in code, data, events, fun, tags, The Echo Nest, visualization on April 22, 2012
I spent this weekend at Rethink Music Hackers’ Weekend building a music hack called Map of Music Styles (aka MOMS). This hack presents a visualization of over 1000 music styles. You can pan and zoom through the music space just like you can with Google maps. When you see an interesting style of music you can click on it to hear some samples of music of that style.

It is fun to explore all the different neighborhoods of music styles. Here’s the Asian corner:

Here’s the Hip-Hop neighborhood:

And a mega-cluster of ambient/chill-out music:

To build the app, I collected the top 2,000 or so terms via The Echo Nest API. For each term I calculated the most similar terms based upon artist overlap (for instance, the term ‘metal’ and ‘heavy metal’ are often applied to the same artists and so can be considered similar, where as ‘metal’ and ‘new age’ are rarely applied to the same artist and are, therefore, not similar). To layout the graph I used Gephi (Its like Photoshop for graphs) and exported the graph to SVG. After that it was just a bit of Javascript, HTML, and CSS to create the web page that will let you pan and zoom. When you click on a term, I fetch audio that matches the style via the Echo Nest and 7Digital APIs.
There are a few non-styles that snuck through – the occasional band name, or mood, but they don’t hurt anything so I let them hang out with the real styles. The app works best in Chrome. There’s a bug in the Firefox version that I need to work out.
Give it a try and let me know how you like it: Map of Music Styles
Boil the Frog – the unreleased Spotify Version
Update – You are probably looking for this web-based version of Boil The Frog and the blog post about it.

The rest of this article is about the unreleased Spotify Version of Boil the Frog.

I’m at Music Apps Hack Weekend doing my favorite thing: hacking on music. I’ve just finished my hack called Boil the Frog. Boil the Frog is a Spotify App that will create playlists that gradually take you from one music style to another. It is like the proverbial story of the frog in the pot of water. If you heat the water gradually, the frog won’t notice and will happily sit in the pot until it becomes frog stew. With Boil the Frog you can do the same thing musically. Create a playlist that gradually takes your pre-teen from Miley Cyrus to Miles Davis, or perhaps more perversely the Kenny G fan to Cannibal Corpse.
To build the app I built an artist similarity graph of 100,000 of the most popular artists. I use The Echo Nest artist similarity to connect each artist to its four nearest neighbors. To find the path between any two artists I use a bidirectional Dijkstra shortest path algorithm. Most paths can be computed in less than 100ms.

The Spotify Apps API is the perfect hacking platform. You can build a Spotify app that has full access to the vast Spotify music catalog and artwork, along with access to the listener’s catalog. Since the Spotify Apps run in an embedded browser all of your web app programming skills apply. You can use jQuery, make calls to JSON APIs, use HTML 5 canvas. It is all there. Spotify has done a really good job putting together this platform. The only downside is that, unlike the web, it is hard to actually release Spotify apps, but the Spotify team is working to make this easier. I’d love to release Boil the Frog because it is really fun to make playlists that bring you from one music style to another. It is interesting to see what musical neighborhoods you wander through on your way. For instance, I made a Kenny G to Cannibal Corpse playlist. To get there, the playlist brought me from easy listening, to movie soundtracks and then through video game soundtracks to get to the heavy metal world. Cool stuff. If you want to see a playlist between two artists let me know in the comments and I’ll create and share the playlist with you.
I made a video of Boil the Frog in action. Check it out:
[youtube http://youtu.be/Nj6JAxm9aPE]
Update: I’ve just pushed the client code out to github: https://github.com/plamere/boilthefrog
Looking for the Slow Build
This is the second in a series of posts exploring the Million Song Dataset.

Every few months you’ll see a query like this on Reddit – someone is looking for songs that slowly build in intensity. It’s an interesting music query since it is primarily focused on what the music sounds like. Since we’ve analyzed the audio of millions and millions of tracks here at The Echo Nest we should be able to automate this type of query. One would expect that Slow Build songs will have a steady increase in volume over the course of a song, so lets look at the loudness data for a few Slow Build songs to confirm this intuition. First, here’s the canonical slow builder: Stairway to Heaven:
 The green line is the raw loudness data, the blue line is a smoothed version of the data. Clearly we see a rise in the volume over the course of the song. Let’s look at another classic Slow Build – The Hall Of the Mountain King – again our intuition is confirmed:

Looking at a non-Slow Build song like Katy Perry’s California Gurls we see that the loudness curve is quite flat by comparison:

Of course there are other aspects beyond loudness that a musician may use to build a song to a climax – tempo, timbre and harmony are all useful, but to keep things simple I’m going to focus only on loudness.
Looking at these plots it is easy to see which songs have a Slow Build. To algorithmically identify songs that have a slow build, we can use a technique similar to the one I described in The Stairway Detector. It is a simple algorithm that compares the average loudness of the first half of the song to the average loudness of the second half of the song. Songs with the biggest increase in average loudness rank the highest. For example, take a look at a loudness plot for Stairway to Heaven. You can see that there is a distinct rise in scores from the first half to the second half of the song (the horizontal dashed lines show the average loudness for the first and second half of the song). Calculating the ramp factor we see that Stairway to Heaven scores an 11.36 meaning that there is an increase in average loudness of 11.36 decibels between the first and the second half of the song.
This algorithm has some flaws – for instance it will give very high scores to ‘hidden track’ songs. Artists will sometimes ‘hide’ a track at the end of a CD by padding the beginning of the track with a few minutes of silence. For example, this track by ‘Fudge Tunnel’ has about five minutes of silence before the band comes in.

Clearly this song isn’t a Slow Build, our simple algorithm is fooled. To fix this we need to introduce a measure of how straight the ramp is. One way to measure the straightness of a line is to calculate the Pearson correlation for the loudness data as a function of time. XY Data with correlation that approaches one (or negative one) is by definition, linear. This nifty wikipedia visualization of the correlation of different datasets shows the correlation for various datasets:
 We can combine the correlation with our ramp factors to generate an overall score that takes into account the ramp of the song as well as the straightness of the ramp. The overall score serves as our Slow Build detector. Songs with a high score are Slow Build songs. I suspect that there are better algorithms for this so if you are a math-oriented reader who is cringing at my naivete please set me and my algorithm straight.
Armed with our Slow Build Detector, I built a little web app that lets you explore for Slow Build songs. The app – Looking For The Slow Build – looks like this:

The application lets you type in the name of your favorite song and will give you a plot of the loudness over the course of the song, and calculates the overall Slow Build score along with the ramp and correlation. If you find a song with an exceptionally high Slow Build score it will be added to the gallery. I challenge you to get at least one song in the gallery.
You may find that some songs that you think should get a high Slow Build score don’t score as high as you would expect. For instance, take the song Hoppipolla by Sigur Ros. It seems to have a good build, but it scores low:

It has an early build but after a minute it has reached it’s zenith. The ending is symmetrical with the beginning with a minute of fade. This explains the low score.
Another song that builds but has a low score is Weezer’s The Angel and the One.

This song has a 4 minute power ballad build – but fails to qualify a a slow build because the last 2 minutes of the song are nearly silent.
Finding Slow Build songs in the Million Song Dataset
Now that we have an algorithm that finds Slow Build songs, lets apply it to the Million Song Dataset. I can create a simple MapReduce job in Python that will go through all of the million tracks and calculate the Slow Build score for each of them to help us find the songs with the biggest Slow Build. I’m using the same framework that I described in the post “How to Process a Million Songs in 20 minutes“. I use the S3 hosted version of the Million Song Dataset and process it via Amazon’s Elastic MapReduce using mrjob – a Python MapReduce library. Here’s the mapper that does almost all of the work, the full code is on github in cramp.py:
    def mapper(self, _, line):
        """ The mapper loads a track and yields its ramp factor """
        t = track.load_track(line)
        if t and t['duration'] > 60 and len(t['segments']) > 20:
            segments = t['segments']
            half_track = t['duration'] / 2
            first_half = 0
            second_half = 0
            first_count = 0
            second_count = 0

            xdata = []
            ydata = []
            for i in xrange(len(segments)):
                seg = segments[i]
                seg_loudness = seg['loudness_max'] * seg['duration']

                if seg['start'] + seg['duration'] <= half_track:
                    seg_loudness = seg['loudness_max'] * seg['duration']
                    first_half += seg_loudness
                    first_count += 1
                elif seg['start'] < half_track and seg['start'] + seg['duration'] > half_track:
                    # this is the nasty segment that spans the song midpoint.
                    # apportion the loudness appropriately
                    first_seg_loudness = seg['loudness_max'] * (half_track - seg['start'])
                    first_half += first_seg_loudness
                    first_count += 1

                    second_seg_loudness = seg['loudness_max'] * (seg['duration'] - (half_track - seg['start']))
                    second_half += second_seg_loudness
                    second_count += 1
                else:
                    seg_loudness = seg['loudness_max'] * seg['duration']
                    second_half += seg_loudness
                    second_count += 1

                xdata.append( seg['start'] )
                ydata.append( seg['loudness_max'] )

            correlation = pearsonr(xdata, ydata)
            ramp_factor = second_half / half_track - first_half / half_track
            if YIELD_ALL or ramp_factor > 10 and correlation > .5:
                yield (t['artist_name'], t['title'], t['track_id'], correlation), ramp_factor
This code takes less than a half hour to run on 50 small EC2 instances and finds a bucketload of Slow Build songs. I’ve created a page of plots of the top 500 or so Slow Build songs found by this job. There are all sorts of hidden gems in there. Go check it out:
Looking for the Slow Build in the Million Song Dataset
The page has 500 plots all linked to Spotify so you can listen to any song that strikes your fancy. Here are some my favorite discoveries:
Respighi’s The Pines of the Appian Way
I remember playing this in the orchestra back in high school. It really is sublime. Click the plot to listen in Spotify.

Maria Friedman’s Play The Song Again
So very theatrical

Mandy Patinkin’s Rock-A-Bye Your Baby With A Dixie Melody
Another song that seems to be right off of Broadway – it has an awesome slow build.


- The Million Song Dataset – deep data about a million songs
- The Stairway Index – my first look at this stuff about 2 years ago
- How to process a million songs in 20 minutes – a blog post about how to process the MSD with mrjob and Elastic Map Reduce
- Looking for the Slow Build – a simple web app that calculates the Slow Build score and loudness plot for just about any song
- cramp.py – the MapReduce code for calculating Slow Build scores for the MSD
- Looking for the Slow Build in the Million Song Dataset – 500 loudness plots of the top Slow Builders
- Top Slow Build songs in the Million Song Dataset – the top 6K songs with a Slow Build score of 10 and above
- A Spotify collaborative playlist with a bunch of Slow Build songs in it. Feel free to add more.
