In previous posts, we’ve seen that different regions of the country can have different listening preferences. So far we’ve looked at the distinctive artists in any particular region. Perhaps equally interesting is to look at artists that get much fewer listens in a particular region than you would expect. These are the regional anti-preferences, the artists that are generally popular across the United States, but get much less love in a particular part of the country.
To find these artists, we merely look for artists that drop the furthest in rank on the top-most-played chart for a region when compared to the whole U.S. For example, we can look at the top 50 artists in the United States, and find those artists of the 50 that drop furthest in rank on the New Hampshire chart. Try it yourself. Here are the results:
Artists listened to more in United States than they are in New Hampshire
| # | Artist | Rank in United States |
Rank in New Hampshire |
Delta |
|---|---|---|---|---|
| 1 | R. Kelly | 42 | 720 | -678 |
| 2 | 2Pac | 45 | 243 | -198 |
| 3 | Usher | 46 | 205 | -159 |
| 4 | Coldplay | 36 | 155 | -119 |
| 5 | Chris Brown | 37 | 120 | -83 |
R. Kelly is ranked the 42nd most popular artist in the U.S., but in New Hampshire he’s the 720th most popular, a drop of 678 positions on the chart making him the most ignored artist in New Hampshire.
We can do this for each of the states in the United States and of course we can put them on a map. Here’s a map that shows the most ignored artist of the U.S. top-50 artist in each state.
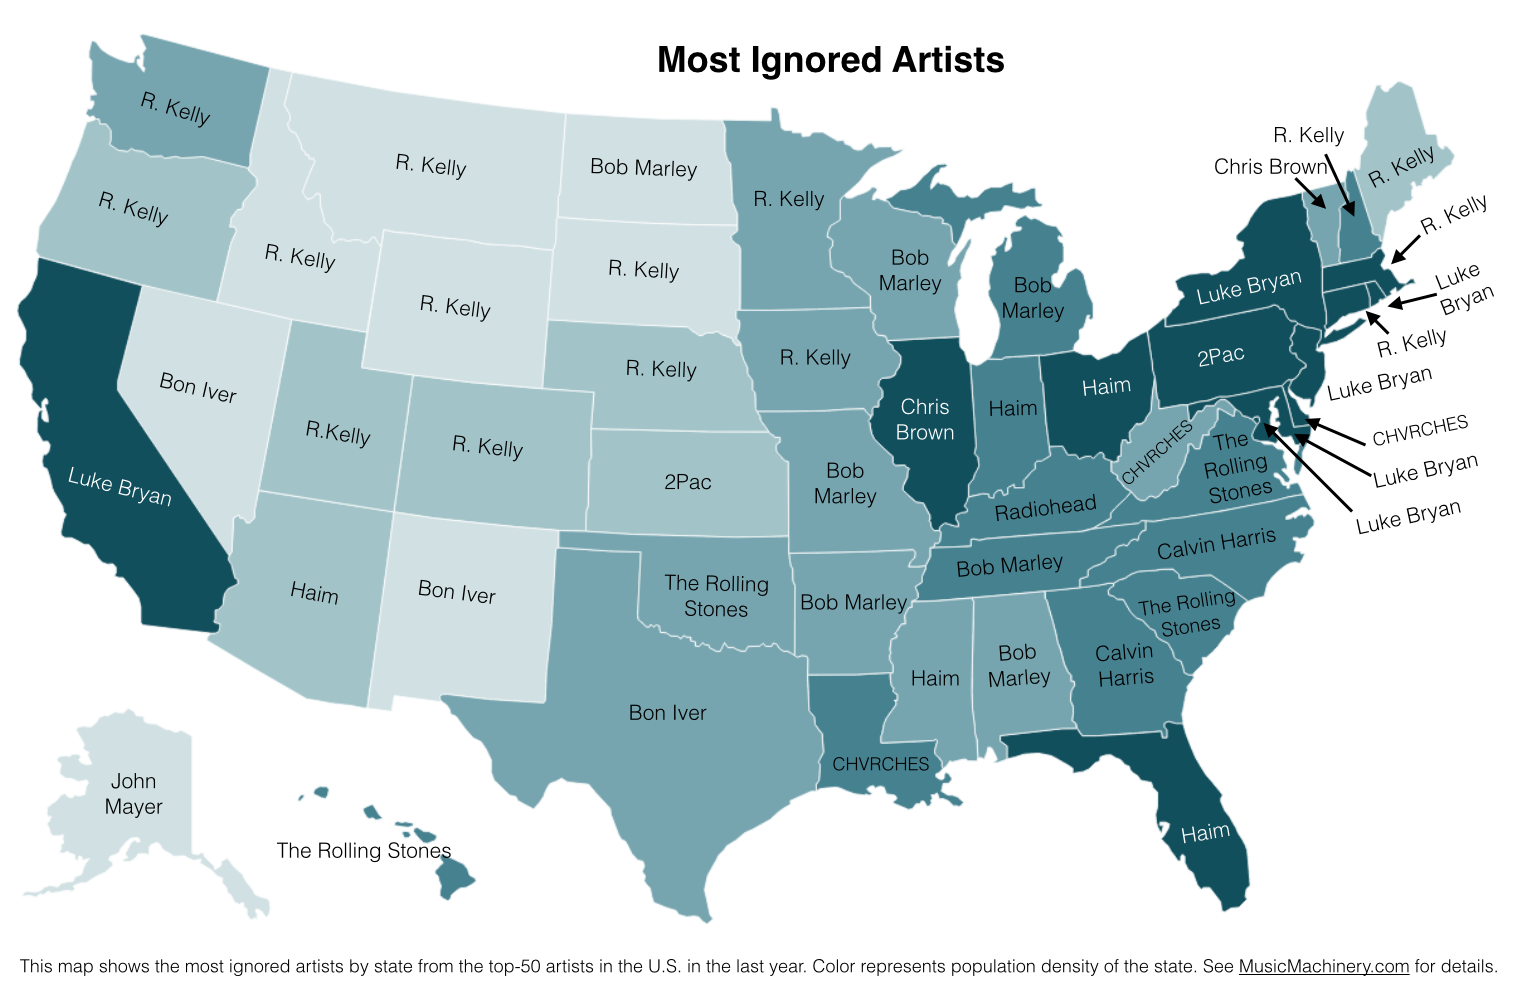
What can we do with this information? If we know where a music listener lives, but we know nothing else about them, we can potentially improve their listening experience by giving them music based upon their local charts instead of the global or national charts. We can also improve the listening even if we don’t know where the listener is from. As we can see from the map, certain artists are polarizing artists, liked in some circles and disliked in others. If we eliminate the polarizing artists for a listener that we know nothing about, we can reduce the risk of musically offending the listener. Of course, once we know a little bit about the music taste of a listener we can greatly improve their recommendations beyond what we can do based solely on demographic info such as the listener location.
Future work There are a few more experiments that I’d like to try with regard to exploring regional preferences. In particular I think it’d be fun to generate an artist similarity metric based solely on regional listening behaviors. In this world, Juicy J, the southern rapper, and Hillsong United, the worship band would be very similar since they both get lots of listens from people in Memphis. A few readers have suggested alternate scoring algorithms to try, and of course it would be interesting to repeat these experiments for other parts of the world. So much music data, so little time! However, this may be the last map I make for a while since the Internet must be getting sick of ‘artists on a map’ by now.
Credit and thanks to Randal Cooper (@fancycwabs) for creating the first set of anti-preference maps. Check out his blog and the Business Insider article about his work.
The data for the map is drawn from an aggregation of data across a wide range of music services powered by The Echo Nest and is based on the listening behavior of a quarter million online music listeners.

#1 by fancycwabs on February 28, 2014 - 11:49 am
Had I been in possession of a couple of highlighters, I might have also included the “intensity” of the dislike in a given state, e.g. Maine REALLY hates R. Kelly (-2143), while Illinois doesn’t much care for Chris Brown (-33)
#2 by Paul on February 28, 2014 - 11:53 am
Are those maps created on paper? (!)
#3 by fancycwabs on February 28, 2014 - 12:20 pm
Well, I didn’t draw them by hand, but yeah–easier to scribble names on a printed out map at the bar than to haul around a laptop, find a mapping program, etc. etc.
#4 by Paul on February 28, 2014 - 12:21 pm
my approach was similarly low-tech. I found a base map and then used Keynote to annotate each state.
#5 by Terry Gotham on March 2, 2014 - 3:34 am
Reblogged this on Terry Gotham and commented:
And the internet vindicates me. Everyone in the USA hates R. Kelly. There’s hope for America yet.
#6 by 7zl on March 8, 2014 - 12:24 am
What I don’t understand: where do all the R. Kelly listeners live if all the states seem to ignore him?
#7 by Paul on March 8, 2014 - 7:35 pm
Not all the states ignore him