In previous posts we looked at how gender and age can affect listening preferences. Today we take a look at how the location of a listener may affect their listening preferences.
For this study, I sampled the listening preferences of about a quarter million listeners that have a zip code associated with their account. update: Listener data is drawn from a variety of music streaming services that are powered by The Echo Nest. I aggregated these listeners into regions (state, regional and all-US). To compare regions I look at the top-N most popular artists based upon listener plays in each region and look for artists that have a substantial change in rank between the two regions. These artists are the artists that define the taste for the region.
As an example let’s compare Tennessee to New England. If we look at the top 100 artists listened to in Tennessee and see which artists fall the furthest on the New England chart we find these 10 artists:
| # | Artist | Rank in Tennessee |
Rank in New England |
Delta |
|---|---|---|---|---|
| 1 | Hillsong United | 97 | 1097 | -1000 |
| 2 | Juicy J | 47 | 664 | -617 |
| 3 | Young Jeezy | 78 | 579 | -501 |
| 4 | R. Kelly | 26 | 259 | -233 |
| 5 | 2 Chainz | 63 | 288 | -225 |
| 6 | Eric Church | 79 | 286 | -207 |
| 7 | The 1975 | 87 | 268 | -181 |
| 8 | T.I. | 40 | 211 | -171 |
| 9 | The Civil Wars | 22 | 150 | -128 |
| 10 | Blake Shelton | 58 | 184 | -126 |
The first artist, Hillsong United is the 97th most popular artist in Tennessee for our sample of listeners. In New England, Hillsong United drops all the way to the 1097th artist, a drop in rank of 1,000. Hillsong United is a Christian rock worship band. Tennessee listeners, living in the heart of the U.S. Bible Belt, listen to Hillsong United much more than their New England counterparts. Second on the Tennessee list is Juicy J,a rapper, songwriter and record producer from Memphis, Tennessee. Third is Young Jeezy from nearby Atlanta Georgia. The rest of the top 10 is dominated by southern rappers, country, and folk artists.
Now let’s look at top 100 New England artists and see which artists fall furthest on the Tennessee charts:
| # | Artist | Rank in New England |
Rank in Tennessee |
Delta |
|---|---|---|---|---|
| 1 | Phish | 89 | 431 | -342 |
| 2 | Grateful Dead | 45 | 222 | -177 |
| 3 | Talking Heads | 86 | 254 | -168 |
| 4 | Neil Young | 53 | 182 | -129 |
| 5 | Bonobo | 60 | 189 | -129 |
| 6 | Billy Joel | 90 | 218 | -128 |
| 7 | Bruce Springsteen | 48 | 175 | -127 |
| 8 | The XX | 44 | 158 | -114 |
| 9 | Modest Mouse | 85 | 179 | -94 |
| 10 | Bob Marley | 30 | 123 | -93 |
New England tastes run to jam bands, indie and classic rock.
Exploring Region differences on your own
I built an app that makes it easy to explore the regional differences in music. With the app you can select two regions and it will show you which artists are distinctive for each region.

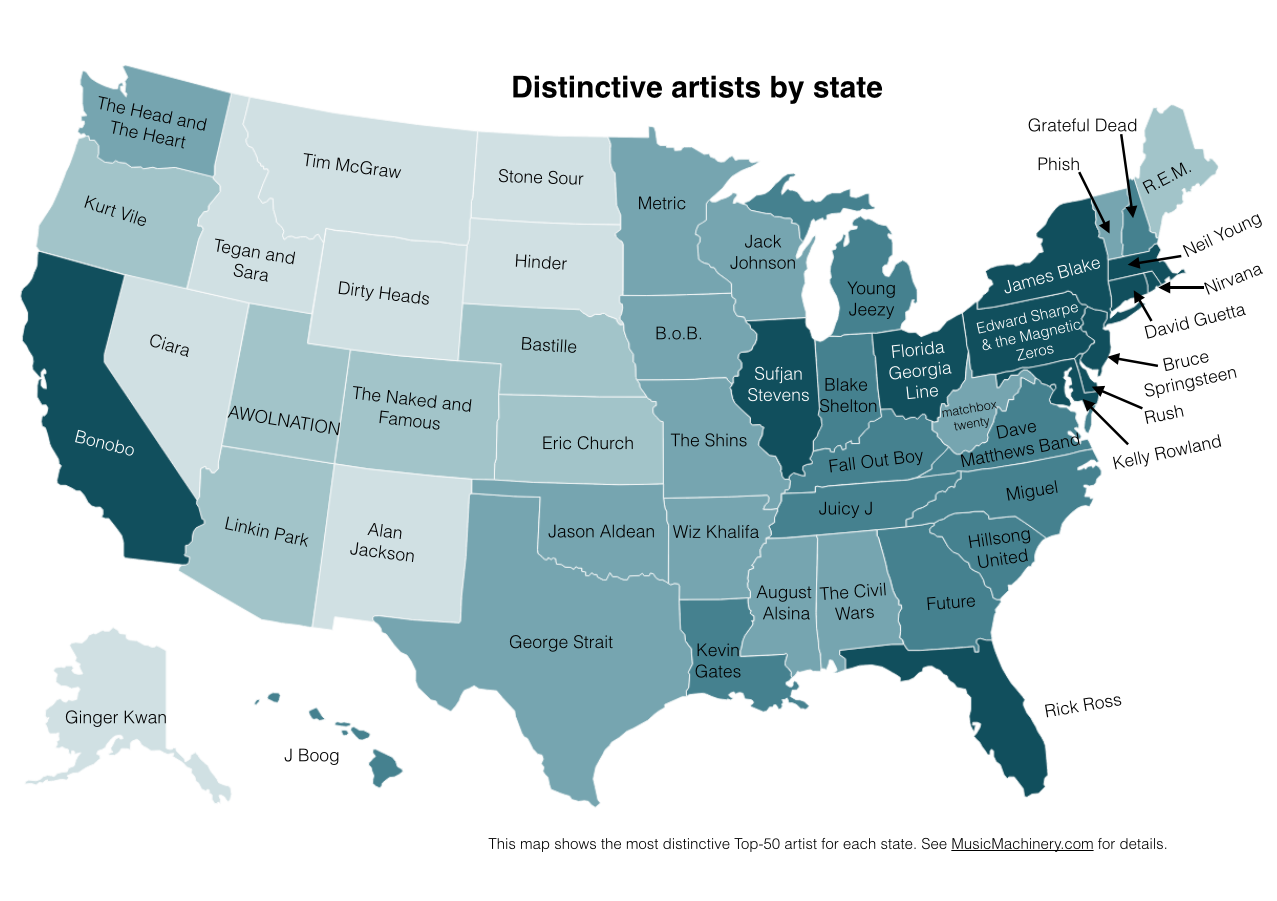
Using this approach we can pick a single signature artist for each state. I do this by finding the top most distinctive popular artist for a state that hasn’t already been selected for a more populous state. Here’s the list of signature state artists:
| State | Name | State Rank | US Rank | Change |
| AK | Ginger Kwan | 33 | 12062 | -12029 |
| AL | The Civil Wars | 34 | 110 | -76 |
| AR | Wiz Khalifa | 15 | 69 | -54 |
| AZ | Linkin Park | 47 | 98 | -51 |
| CA | Bonobo | 28 | 85 | -57 |
| CO | The Naked And Famous | 48 | 125 | -77 |
| CT | David Guetta | 43 | 80 | -37 |
| DE | Rush | 38 | 385 | -347 |
| FL | Rick Ross | 44 | 103 | -59 |
| GA | Future | 33 | 226 | -193 |
| HI | J Boog | 40 | 4703 | -4663 |
| IA | B.o.B | 32 | 82 | -50 |
| ID | Tegan and Sara | 31 | 107 | -76 |
| IL | Sufjan Stevens | 38 | 68 | -30 |
| IN | Blake Shelton | 31 | 91 | -60 |
| KS | Eric Church | 48 | 162 | -114 |
| KY | Fall Out Boy | 17 | 59 | -42 |
| LA | Kevin Gates | 15 | 1359 | -1344 |
| MA | Neil Young | 49 | 128 | -79 |
| MD | Kelly Rowland | 45 | 217 | -172 |
| ME | R.E.M. | 28 | 197 | -169 |
| MI | Young Jeezy | 34 | 138 | -104 |
| MN | Metric | 41 | 211 | -170 |
| MO | The Shins | 29 | 67 | -38 |
| MS | August Alsina | 42 | 909 | -867 |
| MT | Tim McGraw | 36 | 187 | -151 |
| NC | Miguel | 37 | 88 | -51 |
| ND | Stone Sour | 47 | 735 | -688 |
| NE | Bastille | 48 | 89 | -41 |
| NH | Grateful Dead | 29 | 191 | -162 |
| NJ | Bruce Springsteen | 23 | 109 | -86 |
| NM | Alan Jackson | 45 | 425 | -380 |
| NV | Ciara | 34 | 106 | -72 |
| NY | James Blake | 47 | 130 | -83 |
| OH | Florida Georgia Line | 26 | 75 | -49 |
| OK | Jason Aldean | 24 | 84 | -60 |
| OR | Kurt Vile | 49 | 212 | -163 |
| PA | Edward Sharpe & the Magnetic Zeros | 43 | 77 | -34 |
| RI | Nirvana | 48 | 126 | -78 |
| SC | Hillsong United | 24 | 262 | -238 |
| SD | Hinder | 42 | 1154 | -1112 |
| TN | Juicy J | 47 | 151 | -104 |
| TX | George Strait | 16 | 199 | -183 |
| UT | AWOLNATION | 31 | 111 | -80 |
| VA | Dave Matthews Band | 48 | 113 | -65 |
| VT | Phish | 5 | 353 | -348 |
| WA | The Head and the Heart | 22 | 83 | -61 |
| WI | Jack Johnson | 45 | 99 | -54 |
| WV | matchbox twenty | 48 | 282 | -234 |
| WY | Dirty Heads | 48 | 1334 | -1286 |
It is pretty clear that people in different parts of the US listen to different kinds of music. These regionalisms can be used to help recommend music for people when you otherwise might not know anything about their music taste.
Note – the base map in the visualizations is shaded by population density.

#1 by Chris Adams on February 25, 2014 - 2:44 pm
Do you have the data for the District of Columbia? I’m curious how it compares to the MD / VA divide: https://musicmachinery.com/2014/02/25/exploring-regional-listening-preferences/
#2 by Paul on February 25, 2014 - 2:54 pm
Hi Chris – I just pushed out an update that includes DC. It was an accidental omission. Here’s DC compared to all US.
P
#3 by jszink on February 25, 2014 - 4:10 pm
Hi! This is awesome. Couldn’t find where to contact you, but wanted to let you know Juicy J is spelled wrong here: Second on the Tennessee list is Jucy J,a rapper. Now that it’s viral, just wanted to give you a heads up!
#4 by jennieszink on February 25, 2014 - 4:11 pm
Hi, this is awesome! Since it went viral, just wanted to give you a heads up that you misspelled Juicy J here: Second on the Tennessee list is Jucy J,a rapper. (Sorry, couldn’t find out where to contact you).
#5 by Paul on February 25, 2014 - 4:14 pm
thanks! Fixed.
#6 by MidwestCowboy on February 25, 2014 - 5:26 pm
Perhaps I missed it, but what is the color significance on the map? Is the dark blue of Sufjan Stevens in Illinois a greater representation of his popularity? Or would that belong to the lighter shades of blue of Tegan and Sara in Idaho?
Thanks. Very well done.
#7 by Paul on February 25, 2014 - 5:27 pm
The color represents the relative population of the state.
#8 by chuckdriver on February 25, 2014 - 11:06 pm
Am I missing something, or do you mean population density?
#9 by kernerator on February 25, 2014 - 6:38 pm
You have people linking to this claiming that the map shows the most popular artist in each state. On the table of “signature artists” for each state could you add a column to list the rank of of that artist in the given state?
#10 by Paul on February 25, 2014 - 6:43 pm
That’s a good idea. I’ll have that data in a bit
#11 by AP on February 25, 2014 - 6:46 pm
Could you clarify how you define the “most distinctive” artist? Also, is there anywhere that the rankings by state can be viewed?
#12 by Paul on February 25, 2014 - 7:06 pm
Hi Alex – As I explain in the blog post, ‘most distinctive’ is defined by finding the top-N most popular artists in a region and looking for artists that have a substantial change in rank between as compared to all listners. These artists are the artists that define the taste for the region.
#13 by heathereira on February 25, 2014 - 10:25 pm
Could you explain what the depth option of the “Regionalisms in U.S. Listening Preferences” app means? I was curious from this map because as someone who has grown up in Portland, OR and involved in the music scene, I’d never heard of Kurt Vile. Also, is the app constantly updated or something? When I checked all the depth option for Oregon vs. the United States, Kurt Vile was not number one for any one them.
#14 by Paul on February 26, 2014 - 8:22 am
Hi Heather. The ‘depth’ option controls how far we look into the top charts of region 1. So with a depth set to 100 when comparing OR to the US, we will look through the top 100 artists in OR and look at how much their ranks change compared to the US. The app is not updated. When I made the map, I set the depth to 50. When you do that you will see that Kurt Vile is on the top. You should listen to Kurt Vile, since you are from Oregon.
#15 by Alex Cannon (@acannon828) on February 26, 2014 - 2:32 am
Different Alex here, very cool stuff but I’m still confused as to where the artists on the map are coming from. David Guetta for example is listed as the most distinctive artist for Connecticut yet on the CT vs. US chart he’s ranked 187th by your “delta” metric…
#16 by Paul on February 26, 2014 - 6:56 am
Hi Alex – for the map, I’m chosing from the top 50 artists for a state. Here’s the link for CT.
#17 by AP on February 25, 2014 - 7:23 pm
Thanks Paul. I think I must still be missing something as when I consider Colorado vs United States, it would seem that Gregory Alan Isakov is the most distinctive top 100 artist in Colorado. Perhaps the overall US ranking isn’t the right comparison set? Either way, it’s a very interesting view of how different listening interests are across the state. Thanks for the response.
#18 by Paul on February 25, 2014 - 7:28 pm
Hi Alex – for the state rankings I limited the artist to the top 50 artists in the state in order to surface more recognizable artists. Indeed, as you deepen the search, many more very distinctive artists surface. — Paul
#19 by AP on February 25, 2014 - 7:34 pm
Ah, okay. The map says Top 100. It all makes sense now. Thanks Paul.
#20 by Paul on February 25, 2014 - 7:35 pm
Yes, indeed that’s an error.
#21 by Adam on February 25, 2014 - 7:41 pm
I live in Portland, Oregon. Who the f*** is Kurt Vile
#22 by David Kaz (@FistfulOfDave) on February 25, 2014 - 10:07 pm
http://lmgtfy.com/?q=Kurt+Vile
#23 by james on February 25, 2014 - 7:47 pm
Cool stuff. Thanks for sharing!
#24 by Paul on February 25, 2014 - 7:48 pm
ubet!
#25 by Luis on February 25, 2014 - 7:50 pm
Where did you get all this data from? I’m mainly asking because I’m from California amd have no fucking clue who bonobo is.
#26 by Paul on February 25, 2014 - 8:00 pm
The data is not a measure of popularity, it is a measure of distinctiveness, it is showing the artists that are listened to more in California than they are in other parts of the country. Take a deeper look here.
#27 by RJ on February 25, 2014 - 11:46 pm
Hey Paul –
Why wasn’t California’s Hot Chip? http://static.echonest.com/geo_listening_preferences/?r1=united_states&r1=CA&depth=200
#28 by Paul on February 26, 2014 - 7:18 am
Hi RJ – the depth I used for the map is 50, not 200. Example.
#29 by fnasf on February 25, 2014 - 8:32 pm
You should still listen to Bonobo :) Beautiful music of a very talented man.
I’ve seen him about 4 times!
#30 by dscweb on February 25, 2014 - 8:29 pm
Is this Spotify user data? Or some other data?
#31 by Paul on February 25, 2014 - 8:30 pm
it is data aggregated from a wide number of music services.
#32 by Adam Weiss on February 25, 2014 - 9:52 pm
Can you be more specific? It’s hard to take any sampled data seriously without a full explanation of exactly how it was sampled. It’s just far too easy to bias the results.
#33 by Paul on February 25, 2014 - 10:02 pm
Adam – I can’t be completely specific – the exact amount of data available and the contributing services to the dataset are not public. I can tell you some of the likely confounding affects are the over-representation of hardcore music fans and upper income listeners (those two categories are more likely to be members of the music services that may have a monthly subscription and/or require high speed internet + mobile access). Picking a single artist to represent the distinctive listening for a state is, of course a gross simplification – the world is too complex for that to be an accurate view of the world. The map is really meant as a teaser to get people to read the article and to play with the chart comparison tool that makes the underlying patterns and data more obvious.
#34 by zachariah on February 25, 2014 - 8:35 pm
who the hell is the necked and famous? and bonobo is the sheeeet
#35 by dscweb on February 25, 2014 - 8:36 pm
This interesting. Is the data from multiple music apps? I would guess that different music services would give very different results.
#36 by dscweb on February 25, 2014 - 8:38 pm
Sorry. Didn’t see your earlier reply.
#37 by jk on February 25, 2014 - 8:36 pm
What was the account you were using to gather zip code data of listeners? I wonder if it would make a difference if it was streaming, digital or physical sales. I do not know the artist who represents my state btw!
#38 by Anna Johnson on February 25, 2014 - 9:10 pm
Please check your facts. Tim McGraw was born in LA and currently resides in Nashville, TN – he was not born in Montana.
#39 by Paul on February 25, 2014 - 9:13 pm
Hi Anna – thanks for the info. Note however, that the map is not showing artists that are born in the state, it is showing artists that are distinctive for the state. That is, it shows artists that are listened to more frequently in the state than they are in all the other states. So, Tim Mcgraw ranks higher in the Montana charts than it does in other states.
#40 by Anna Johnson on February 25, 2014 - 9:16 pm
Interesting. So very sorry for the misunderstanding
#41 by Paul on February 25, 2014 - 9:16 pm
no worries! — paul
#42 by Colin on February 25, 2014 - 9:39 pm
Are there just charts listing the top 200, 500, 1000 by state?
#43 by Paul on February 25, 2014 - 9:41 pm
Colin – yes, you can generate these charts yourself.
#44 by James on February 25, 2014 - 10:09 pm
How exactly do you generate a chart for top artists by state?
#45 by Paul on February 25, 2014 - 10:12 pm
The blog post explains how. I get the listening data for listeners that have provided their zipcodes. I know what state each zipcode is in and so I know how many plays each artist is getting in each state. The artist that gets the most plays is at the top of the chart. But the most popular artist is not the most distinctive artist. To find the most distinctive artist I look for the artist in the top 50 of a state that drops the further in rank on the U.S. top charts.
#46 by Whoisbob on February 25, 2014 - 10:20 pm
B.O.B.? Googling did not help. So confused.
#47 by Paul on February 26, 2014 - 8:22 am
Here you go – http://en.wikipedia.org/wiki/B.o.B
#48 by Michelle P on February 25, 2014 - 10:48 pm
Why is George Strait the artist they pick for Texas when Z-Ro’s delta is -1441 (aka a lot bigger than -183 for George)?
#49 by Paul on February 26, 2014 - 8:26 am
it’s because I used a depth of 50, not 200 when creating the map. Try it yourself.
#50 by Dean Lake on February 25, 2014 - 11:00 pm
Ah, yes. The ol’ Dead vs Phish battle continues to rage on the New Hampshire/Vermont border. I thought peace had been brokered when Ben and Jerry introduced Phish Food ice cream. Someone was offended by the fudge fish, I presume.
#51 by Realist on February 25, 2014 - 11:23 pm
I think the best part is that I have only ever heard of ~25% of these artists.
#52 by Daniel on February 25, 2014 - 11:59 pm
This is really interesting! Is there a way to search what the most popular artists are by state, without comparing it to another state? Just the 1-100 most popular artists per state. Thanks!
#53 by Paul on February 26, 2014 - 7:17 am
Yes, got to the Regionalisms in Listening Preferences app, and select the same region for Region 1 and Region 2. It will show you the overall most popular artists for that region based upon the sample.
#54 by boris gump on February 26, 2014 - 12:08 am
mainah here ,,, R?E?M ,, you are wrong,,, Portland stations hardly play rem,,, the bone,, the blimp, frank,, and the new classic 100.9,,, i listen to them all,, rarely a rem tune,, and if you go by whats really most mainah’s listen to,,, should be hank williams or some other country artist,,,
#55 by Paul on February 26, 2014 - 7:16 am
thanks theya Boris. This study is not looking a radio play, it is looking at plays on music streaming services. It is what people chose to listen to on their own, vs. what DJs in radio stations chose for them. (Most of those DJs are in NY btw).
#56 by brian on February 26, 2014 - 12:12 am
If Bonobo is 28 in the California State Rank, where can I find what were 1 through 27 ?
#57 by Paul on February 26, 2014 - 7:15 am
Go the here.
#58 by Treye on February 26, 2014 - 12:22 am
Are the lists of top (most popular) artists by state available? I’d be interested in seeing the top N artists for each state, without comparison to any other region.
#59 by Paul on February 26, 2014 - 7:15 am
Yes, got to the Regionalisms in Listening Preferences app, and select the same region for Region 1 and Region 2. It will show you the overall most popular artists for that region based upon the sample.
#60 by Treye on February 26, 2014 - 10:29 am
Thanks, I tired that last night, and didn’t get any results. I tried again this morning, and it looks like it is working now. Great information, thanks for sharing – much appreciated!
#61 by Paul on February 26, 2014 - 11:03 am
yeah, that was a bug, fixed it after seeing your comment and trying it out.
#62 by Your mama on February 26, 2014 - 12:35 am
No offense to you and your article, but your sample is controlled, and far too small. It should read – What a quarter million people people signed up for “X” service likes listening to, while I ignore the other 320 million. Statistics are far more accurate with larger samples from multiple sources. And even then source income plays a larger role than anything as to what artist is listened to and who is not. Your most accurate sample would likely be youtube listens of those who have income to have youtube. Dave Matthews Band consistently sells out across the country, yet Kelly Roland sells out no venue anywhere. Rush sells most of there tickets across the country, Phish sells out, Bruce would, Hell Pink Floyd if they weren’t old and would tour. Blog, or trying to make statistics from nothing to feel relative and sell a service to someone who doesn’t actually care? Okay, thanks
#63 by Paul on February 26, 2014 - 7:09 am
Your mama – thanks for the info on statistics and sample size. Good to know. Thanks too about for the info about which bands are selling out their shows. One thing though, the article is not about which bands are the most popular in a state, it is about which bands are the most distinctive for the state. There’s a big difference.
#64 by ncsuchieftain on February 26, 2014 - 12:42 am
It is interesting because this data seems to go against logic. I am from North Carolina and am rather knowledgeable about the NC music scene and have never heard of Miguel., He is not someone who would character the music scene in North Carolina at all. Apparently, there are enough people in NC listening to him compared to other states that he somehow was chosen based on your algorithms.
#65 by Paul on February 26, 2014 - 7:05 am
thanks again for the anecdote. I’ll be sure to take it into account
#66 by joe (@stang289) on February 26, 2014 - 12:51 am
Im in Florida But My music seems to be in Delaware ?
#67 by Paul on February 26, 2014 - 7:05 am
time to move?
#68 by chronosword on February 26, 2014 - 12:51 am
It is interesting because this data does not seem to be based on the actual music scene of the state. I am from North Carolina and am rather knowledgeable about the music scene here. I have never heard of Miguel and he is not someone who would be indicative of the music scene here.
#69 by Paul on February 26, 2014 - 7:05 am
thanks. I’ll take your anecdote into account.
#70 by Larry Rothfield on February 26, 2014 - 1:28 am
If you are not able to tell us the sources of your data, can you tell us how you went about getting it in general terms?
#71 by Paul on February 26, 2014 - 7:04 am
I work for a company called The Echo Nest. We provide music data and services to a wide range of music streaming companies. This gives us a pretty good view of who is playing what and where.
#72 by reasonableman on February 26, 2014 - 1:29 am
Think there are much deeper results here with regard to music and technology. Here in New Orleans plenty of people listen to Kevin Gates, but plenty more people listen to artists who are off the mainstream digital/chart radar- unsigned or older artists who are all over the radio, or mixtapes (digital or otherwise), or smaller streaming options like local-ish Virdiko. A lot of our audiences, and talent, aren’t particularly technologically sophisticated- and streaming/downloads are by no means ubiquitous- so the results are gonna be skewed. It’s a huge damn shame, because our reliance on music as culture, word-of-mouth, and general oldschool interactions means that artists can find big audiences here, but not necessarily quanitifiable success.
#73 by Paul on February 26, 2014 - 7:03 am
reasonableman – yes, there are many artists that make a region distinctive, and a map that shows a single artist per state is not telling a very complete story. That’s why I also made the Regionalisms in listening Preferences app that lets interested folks explore the topic more deeply. Agree too that the samples from music streaming services will be skewed to the wealthy and/or more musically ‘active’ folks. We can only work with the data that we have. Anyway, thanks for the comments.
#74 by Laurie Bridges on February 26, 2014 - 1:33 am
Interesting information! Is there a timeframe for the information gathered? For example, the last year? Week?
#75 by Paul on February 26, 2014 - 6:58 am
Data was gathered over a year.
#76 by Rob on February 26, 2014 - 1:50 am
It’s frustrating seeing your analysis misrepresented and picked apart using a straw man argument.
#77 by Paul on February 26, 2014 - 6:57 am
Yes, but that’s the Internet. ;)
#78 by 10000Lakes on February 26, 2014 - 1:54 am
Paul, I like this idea, but your MN pick is wrong. Try Bob Dylan, Prince, or Atmosphere. Metric was formed in Toronto, Ontario, Canada
#79 by Paul on February 26, 2014 - 6:57 am
Chris – the map isn’t showing artists that are from a state, it is showing artists that are distinctive for the state – that is, artists that are ranked higher in the state vs. where they rank in the US.
#80 by 10000Lakes on February 26, 2014 - 1:56 am
Nevermind.
#81 by Cindi Jones on February 26, 2014 - 3:06 am
I’m in Iowa.. what is B.o.B.???
#82 by Matthew Incantalupo (@incantalupo) on February 26, 2014 - 5:12 am
This flawed on multiple levels. Among many problems, it uses ranked data as continuous data, but there are other issues as well:
Some of the pairs make sense (e.g.: Bruce Springsteen in NJ and Phish in VT), but upon closer inspection we see that with the exception of Phish (5th most streams in VT), none of these artists are really that popular in their assigned states. Just 5/50 are in the top 20 most streamed artists and 36/50 don’t even crack the top 30 most streamed artists for their assigned state. In other words, I’m really skeptical that there’s a robust R.E.M. fanbase in Maine that’s unlike what we might see in other states.
Just look at how little face validity most of these artist-state pairs have. Wiz Khalifa, whose most popular song is about the colors on the Pittsburgh city flag, is assigned to Arkansas. Kurt Vile, who is outspoken about his Philadelphia roots, is assigned to Oregon. Neither gets assigned to Pennsylvania, where Edward Sharpe & the Magnetic Zeroes (ranked 43rd in PA, 77th nationwide) are apparently a big deal. For the most part, these pairs are arbitrary.
It’s useful to think about it another way. Instead of bands/artists, consider universities. The University of Michigan is clearly the flagship university of the state of Michigan. Any reasonable or useful metric should return it as the “distinctive” Michigan school, right? No university in Michigan receives more applications from state residents. But, based on this methodology, there’s no way that the University of Michigan would be assigned as Michigan’s “favorite university,” because it’s one of the most applied-to schools in all 50 states. Instead, some very obscure university that may not even be very popular in Michigan (but is barely considered in other states) would get assigned to Michigan. Either you need a better way to operationalize distinctiveness, or the concept of distinctiveness isn’t very useful at all.
#83 by Paul on February 26, 2014 - 6:52 am
Hi Matthew – thanks for the input. I think you might be confusing ‘favorite’ and ‘distinctive’ . This map is not showing the most popular or favorite artists in a state, it is showing the artists that are distinctive in the state – that is, they are more popular in the state than they are in general.
There are many knobs to turn when making such a map. I chose to pick from artists from the top 50 in a state and find the one that drops the furthest in rank on the U.S. chart. Anecdotes about artists are interesting, I welcome you to make your own map, you can put Kurt Vile in Penn. As for your Michigan example, yes, U of Michigan should be listed as Michigan’s favorite school. My map is not trying to show favorite artists. Again, feel free to make your own map that shows favorite artists.
#84 by Matthew Incantalupo (@incantalupo) on February 26, 2014 - 7:57 am
I know what you mean and what you did, but I’m also trying to point our problems with not only how you measure distinctiveness, but also with what distinctiveness even means/captures. With respect to measurement, treating ranked data as if they were continuous is unwise. The difference between the #1 and #2 artists is probably very different from the difference between the #39 and #40 artists nationally or in a given state. Also, you don’t account for the fact that some states are bigger than others and have disproportionate influences on national rankings.
Instead, take the number of streams for artists in a given state, standardize them for the total number of songs streamed in the state, and compare those adjusted amounts to the artists’ nationwide streams. Then you can make more adjustments for artists’ relative popularities and have a real measure of each states’ distinct “contribution” to an artist’s streams (call this C) above any national popularity. For each state, identify the artist for which C is the largest (you can break potential ties the same way you do in this post, although it’s less likely you’ll encounter them) and now you’ll actually be able to say something about a distinct relationship between an artist and a state that accounts for the stuff completely muddled by your use of rank data.
I drew your attention to some anecdotes to demonstrate how poorly the measure of “distinctiveness” performs on face value. The reason for this is simple; you don’t account for the raw numbers of streams artists receive, instead rank-ordering them in evenly-spaced intervals, which is clearly wrong. I used the Michigan example to demonstrate that even if your methodology were more sound, I’m not sure this concept of “distinctiveness” actually tells us anything. If it turns out that a small Bible college on the Upper Peninsula is the most “distinctively Michigan” school, what do we do with that information? What does it actually mean that Young Jeezy is the most distinctively Michigan musician, as identified by your method?
(And I’d make my own maps, but you won’t share your data.)
#85 by Paul on February 26, 2014 - 8:13 am
Thanks for the thoughtful replies. Yes, using ranks as a proxy for streams or plays is flawed, but I have some constraints around what data is publishable and what isn’t. I can’t talk about absolute play counts, but I can talk about artist ranks. The number of streams per artist is also a flawed measure of popularity (see this post about one way it is flawed). People have used other flawed proxies for music preference from radio spins to record sales.
Still, I like your idea about looking at each state’s normalized contribution to an artist’s plays. I may give it a go when I have some time.
As for the usefulness of distinctiveness, lets use food as a parallel here. In New Hampshire (where I live) and Vermont, we eat pretty much the same food as anywhere else. McDonalds is very popular, like everywhere else. But there are some distinctive foods like maple syrup and Moxie that are consumed more in NH and VT than most other places. I’m interested in finding the musical equivalent to maple syrup.
#86 by Matthew Incantalupo (@incantalupo) on February 26, 2014 - 8:27 am
The food example is useful and interesting. I think demographers have done some work attempting to capture the distinctiveness of certain names across the United States. You could probably adapt those methods to this purpose without too much trouble. In my own research, I’ve had to generate names (for fictional biographies) that are distinctively white, black, or hispanic, but this is much simpler than trying to match artists to states.
#87 by Paul on February 26, 2014 - 8:31 am
Good idea, the distinctiveness of names in social groups seems to be very similar to what I’m doing here.
#88 by Twiztid Chaos on February 26, 2014 - 6:56 am
Think you need to go back and get a bigger sample from more populated areas. The 2 that were probably asked doesn’t speak for the rest. Example: Jack Johnson… I grew up in 70’s Era and never heard of him. And those polled are obviously not of a vast age group or spread across the state. Just like everything else on the Internet, because it’s on there, doesn’t mean you should believe it. This is one of those instances. I hope people don’t take this blog seriously when choosing a genre of the state. You won’t get the reaction you’re looking for. It’s an old concept of socializing. Try it, you’ll get better results then from this train wreck.
#89 by Paul on February 26, 2014 - 7:24 am
Thanks Twiztid for the input. I didn’t take a survey, instead I looked at the listening patterns of thousands of listeners. What do you think the most distinctive artist for Wisconsin should be?
#90 by kj25 on February 26, 2014 - 7:20 am
Hi! Not sure where a few states fall in the region categories in the app — I’m specifically looking for Kansas’ region. I tried East South Central, East North Central, West North Central and West South Central, but couldn’t see it. Am I missing a “Central central/Great Plains” somewhere or is it not included in a region?
#91 by Paul on February 26, 2014 - 7:29 am
That’s a bug! Kansas should be in West North Central, but I used KA instead of KS for the state abbreviation, so they were accientally ommitted. I shall re-run the wet north central region to get the Kansas data included. My apologies to the Sunflower state.
#92 by Paul on February 26, 2014 - 10:05 am
I’ve updated the database so Kansas is now properly part of West North Central. Thanks for pointing it out.
#93 by Carl Johnson (@CJontheHudson) on February 26, 2014 - 8:07 am
Having read other comments, I still don’t see how you determined what artists were being listened to. Is it just that the artist was streamed to a listener, or was it that the artist was somehow selected (faved, up-voted, whatever the service uses) as something the listener actively wants to hear?
#94 by Paul on February 26, 2014 - 8:15 am
We are looking at artist playcounts on music streams
#95 by Carl Johnson (@CJontheHudson) on February 26, 2014 - 11:55 am
So I guess I would say this isn’t really listening preferences, it’s just what’s reaching the speakers.
#96 by hugh Jardon on February 26, 2014 - 8:10 am
Looks like it’s time to leave the USA.
The music also shows the level of intelligence
#97 by Wenzel Dehn on February 26, 2014 - 8:15 am
GIGO, pure and simple.
#98 by Paul on February 26, 2014 - 8:17 am
which bits are the garbage?
#99 by Arturo on February 26, 2014 - 8:34 am
What? No distinction for DC?
#100 by Paul on February 26, 2014 - 8:37 am
Sorry that I omitted DC from the map. But you can see the full results for DC here. The top distinctive artists for DC are Phosphorescent and Andrew Bird
#101 by Jack on February 26, 2014 - 8:48 am
Moronic. The concept of uniqueness per state leads to all sorts of compromises. So does using state lines as your only demographic. But hey, the sheeple out there cranking out the viral seem to disagree with me, don’t hate.
#102 by Paul on February 26, 2014 - 8:51 am
hey jack, consider the map a teaser, read the blog post and then try out the Regionalisms in US Listening Preferences app. You can work with regions instead of just state lines.
#103 by the craftsy mom on February 26, 2014 - 9:12 am
What is the median age used to come up with these? I live in CT & I’ve never heard of whatever-his-name-is that’s supposedly #1 in CT nor have I heard of many of the other artists/bands listed across the country.
#104 by Paul on February 26, 2014 - 9:30 am
Check out this post to see how listening varies with age. The CT artist, David Guetta is quite well known. He currently has 13 songs on the Billboard Hot 100.
#105 by the craftsy mom on February 26, 2014 - 7:27 pm
I don’t really care how many songs he has on the Billboard Hot 100. I had to Google him. I don’t listen to house music.
As for your comparison of 64 year olds to 13 year olds- my parents are in their 60’s,early 70’s & I can promise you that not only do they NOT listen to most of those artists on that list, but have never heard of most of them; nor they have any idea what Spotify or Pandora is.
I can appreciate your efforts in compiling this data but it does not reflect American tastes accurately. The sampling is too small. I never fit the typical demographics- as a female, I was always in the minority by listening to hard rock & heavy metal. I’ve never been a fan of pop music (except maybe when I was 12 & didn’t know any better).
#106 by Paul on February 26, 2014 - 8:59 pm
Are you are saying that my sample of several thousand listeners from your state is too small, because it doesn’t match the data you collected from your sample of one (or maybe 3 if your parents also live in CT)?
#107 by Steve on February 26, 2014 - 9:24 am
Anyway to get Artist ranked by state or region? Just want to know where Beiber is getting all his money from, then start a petition to banish that state…
#108 by Paul on February 26, 2014 - 9:47 am
Yes, go to the Regionalism in U.S. Listening preferences and enter your state in both regions to see the overall rank from my sample. For example, here’s New England.
#109 by the craftsy mom on February 27, 2014 - 8:28 am
No, I’m saying that a few thousand people is not an accurate representation of any state when you have millions in the population. I was sharing my personal experience. Most older generation folks don’t use digital music services.
#110 by B.Mac on February 26, 2014 - 9:37 am
Paul – as interesting and informative as I find the subject of your research (perhaps I should reconsider a move to California), I’m more fascinated by your responses to the comments here. You’ve responded to nearly every comment posted, and have done so respectfully and cordially. Even when the poster is acting like a – well, a typical trolling knee-jerk reactionary douche (not to say that all or even most of the “negative” comments here fall into that category – most were genuinely asking for clarification and some offering valid critical review of the study).
Bravo, sir. The Internet needs more like you.
#111 by Paul on February 26, 2014 - 9:44 am
thanks much. I assume that many of the folks who visit my blog because of the map post are not very familiar with extracting knowledge from data, so I try to help people understand what I’m trying to do. I also consider it a bit of a fun challenge to try to convert people from angry skeptics to someone who’s more accepting of the data. Perhaps my biggest challenge was trying to convert fifth harmony fans who threatened me with physical violence after a blog post about their efforts to manipulate the chart. In the end, I got lots of very thoughtful comments and insights from folks that I would otherwise not have a chance to talk to about their role in music charts and fandom.
#112 by Harry on February 26, 2014 - 9:44 am
It should be called ‘Top 100 Artists as Determined by Secret Streaming Data Who are Only Moderately Popular in Your State and Even Less Popular in Other States’.
#113 by Paul on February 26, 2014 - 9:45 am
heh, good title, but not quite as catchy.
#114 by echrisy on February 26, 2014 - 10:01 am
I think this is very interesting. I note that many of the states with the smallest deviations between their “signature artist” ranking and that artist’s nationwide ranking are in the Midwest. Interesting, but not particularly surprising. In fact, 5 of the 8 with the smallest difference on that rank come from the 12 Midwestern states. Many marketers recognize this, preferring to test new products in the Midwest, as it represents a reflection of the countries tastes as a whole.
Thanks for the interesting post.
#115 by echrisy on February 26, 2014 - 10:10 am
(before someone catches it… that would be “country’s”, not “countries”.)
#116 by Emily Shaw on February 26, 2014 - 10:30 am
Fun project! I’m still confused about what you’re trying to express with the state colors. Could you put that in a legend near the map?
#117 by Paul on February 26, 2014 - 11:03 am
Hi Emily, thanks for the suggestion. The state colors are merely an indication of how populous the state is.
#118 by Alastair Keith-Lucas on February 26, 2014 - 2:30 pm
I love this map! It’s such a creative and interesting use of statistics. Out of curiosity, why did you choose to include state population in your visual expression?
#119 by Paul on February 26, 2014 - 2:40 pm
its because I’m lazy. I started with a map that was showing the population, and I just went with it.
#120 by Max on February 26, 2014 - 2:47 pm
Is this total population or population density? I think it would clarify things to add a legend explaining the cut offs.
#121 by Paul on February 26, 2014 - 2:49 pm
it is total population.
#122 by Nathan on February 26, 2014 - 4:23 pm
No, if anything I’m pretty sure its population density. Texas has a larger population than any state excepting California yet it is shaded lighter than New York, Florida, and other smaller states.
#123 by Paul on February 26, 2014 - 4:25 pm
yes, it is density.
#124 by BEATS AND BLOOD (@beatsandblood) on February 26, 2014 - 12:10 pm
NO FUCKING WAY Young Jeezy is the favorite ‘band’ of Michigan.
This is a faulty study.
#125 by Paul on February 26, 2014 - 12:16 pm
The study isn’t about finding the favorite artist for a state, it is looking at regional music listening preferences. The map is showing a distinctive artist for a state. Young Jeezy is ranked higher on the Michigan charts than he is on the U.S. charts. Thus he’s a distinctive artist for Michigan.
#126 by Alex on February 26, 2014 - 4:13 pm
Vermont only has about 650,000 people yet is darker than most of the western states that have millions. If the color is population, I am confused, but it’s not very important.
#127 by Paul on February 26, 2014 - 4:25 pm
Alex, you are absolutely right, the map is showing population density not population. I mis-spoke. The base map is from here.
#128 by JK on February 26, 2014 - 5:36 pm
This is a fun game for the Major artists and labels to laugh and poke at but i think this infographic would be more useful if it referred to the emerging and local music community as opposed to the major. Sites like immitter.com that focus primarily on online and offline emerging music disctribution could have certainly helped provide data for the infographic. Ah well. I guess we have something to debate about, until tomorrow.
#129 by jpfed on February 26, 2014 - 10:37 am
Since the most popular states got “dibs” on the most popular artists, I wonder how different it would look to run Gale-Shapley on this data, with states’ preferences for artists being popularity for that state and artists’ preferences for states being determined by state population.
#130 by Paul on February 26, 2014 - 11:02 am
good idea, will give it a go when I get a chance.
#131 by Alex Cannon (@acannon828) on February 26, 2014 - 5:50 pm
By popularity did you mean “distinctiveness” or am I misunderstanding?
#132 by Bill Conant (twoscoopsofpig) on February 26, 2014 - 10:42 am
Curious about how ordering states alphabetically changes which signature band is assigned – do they change if ordered by, say, size of population or land area? Would also like to see it ranked by order of admission to the union, just for giggles.
#133 by Paul on February 26, 2014 - 11:00 am
Alphabetical ordering doesn’t factor into the assignment of artists. I start with the most populated states (California, New York, etc.) and work to the least popular.
#134 by Benjamin Helton on February 26, 2014 - 11:30 am
I think you mean populated.
#135 by Ryan on February 26, 2014 - 11:01 am
Distinctive is the right word when your sample size is .07% of the population. Why even come up with a formula when the sample size is so small? You might want to tell whoever posted it on the Time blog that you don’t want the word favorite and distinctive to be thought of as the same way. She terribly mis-titled your findings to create more of a buzz, probably on purpose, which speaks to her integrity as a journalist. Overall though, your research is laughable. Population is only relevant if your 250K sample size reflects an even ratio throughout the 50 states.
#136 by SPotter on February 26, 2014 - 3:04 pm
Percentage has nothing to do with the reliability of a sample based on its size. If his sample size really is 250K, and is within a magnitude of evenly spread, that is quite enough to predict and differentiate the online listening preferences of the states with quite incredible finesse. You may note that many political polls are based on only 1000 respondents. Population is a rather odd way to order the assigning of favorites, but it is a workable way.
#137 by flynnjason on February 26, 2014 - 11:13 am
What does a map of the most popular artist in a given state look like? Instead of most listened to relative to other states
#138 by Paul on February 26, 2014 - 11:26 am
It would be pretty boring. All the states would have the same handful of artists: Jay-z, Drake, Macklemore, Lorde, Daft Punk.
#139 by Paul on February 28, 2014 - 8:44 am
I made that map. You can see it here
#140 by AdamR on February 26, 2014 - 11:14 am
Interesting stuff. Though I do think it proves three things. First I am very out of touch with today’s popular music, second most people still do not consume their music digitally (most use old fashioned radio) and third that the quote attributed to Mark Twain is correct “There are three kinds of lies: lies, damned lies, and statistics.”
I was curious living in PA and having never heard of Edward Sharp & the Magnetic Zeros, just how distinctive they were. So I walked around the office building I work in and asked 50 people if they have heard of them. These are people from many ages, races and backgrounds (not just my co-workers) and a total of 2 of them have heard of this group/band.
I do realize my sample was very small, but I’m not sure how they could be considered defining the state (loosely) in music when most never heard of them. Maybe that means I need to check them out!!
#141 by Paul on February 26, 2014 - 11:31 am
Hi Adam – this gets to the heart of the trouble with this kind of sampling. I’m looking at the data from people who subscribe to a music service. People who subscribe to music services are generally more engaged music fans, and would likely have taste that tends to the less popular. From my sample of PA listeners, about 25% of them are regular listeners to Edward Sharpe & the Magnetic Zeros – which is more than listen to The Rolling Stones, Queen or Britney Spears.
#142 by thelincster on February 26, 2014 - 12:22 pm
Is it possible that maybe the music service you sampled from is used by a more specific, less populace demographic?
#143 by Paul on February 26, 2014 - 12:24 pm
The data is from a set of music services. People who subscribe to music services are generally more engaged music fans, and would likely have taste that tends toward the slightly less mainstream artists.
#144 by Max on February 26, 2014 - 2:53 pm
I’m wondering how large your samples were from each individual state? Also, its really a stretch to say that these bands get the most support in their respective states. Your data conglomeration just shows how popular bands are from people who subscribe to a certain music service, broken down by state. Expanding your results to the entire state is not really applicable.
#145 by Paul on February 26, 2014 - 3:00 pm
The target per-state sample size was 5,000 listeners, but for some smaller states, fewer listeners were used.
#146 by BEATS AND BLOOD (@beatsandblood) on February 26, 2014 - 12:12 pm
You are VERY wrong about most people not consuming their music digitally.
Pretty much everyone under 40 that I know consumes their music digitally.
The ONLY time I even hear the radio is when I am in the car with my mother.
#147 by Leigh S. on February 26, 2014 - 11:25 am
Interesting, considering I’ve never heard of Bonobo…
#148 by Sassmo on February 26, 2014 - 12:33 pm
Then you haven’t lived.
#149 by cousin cole on February 26, 2014 - 11:31 am
I think it’d be more interesting if the color reflected the amount of deviation between that state’s preference for the artist and the national preference for the same, rather than just population
#150 by Paul on February 26, 2014 - 11:32 am
Agreed, but that ship has sailed unfortunately. The map is all over the net, there’s no way to update it now.
#151 by madhatternalice on February 26, 2014 - 11:37 am
So, DC doesn’t count as a state?
#152 by Paul on February 26, 2014 - 11:54 am
technically no, but I do have the data here.
#153 by madhatternalice on February 26, 2014 - 1:24 pm
Thanks! Kinda disappointed it didn’t make the map, but I can’t control how you see DC.
#154 by MattT on February 27, 2014 - 12:29 am
Why should it? DC isn’t a state.
#155 by Tyler Smith on February 26, 2014 - 11:48 am
Paul, thanks for this study! You mentioned that you were able to determine what people were listening to based on their zipcode. This information would be very helpful to me since, as a worship pastor at a church in Indiana, I have often wondered what kinds of music my church members are listening to. Is there a way that I can determine what people are listening to in my zipcode?
#156 by Paul on February 26, 2014 - 11:53 am
Hi Tyler – sorry, the zipcode data is not public data, but since you have a direct relationship with your congregation, perhaps you should just be able to ask them what music they listen to.
#157 by Tyler Smith on February 26, 2014 - 11:56 am
Gotcha. Thanks, Paul. Yes, I have actually been considering the possibility of sending out a survey in my congregation to ask them several questions about their musical preferences, this question being one of them. Thanks again!
#158 by Aaron on February 26, 2014 - 11:49 am
I think using “rank change” is the source of some of the surprising results here. That would seem to favor lower-rank artists, because the more densely packed artists are in terms of play count, the more ranks you drop by losing a fixed proportion of your listeners.
In other words, if the #1 band had half as many fans, they’d be… #10? #100, at the absolute worst? While if the #500 band had half as many fans, it would lose way more than 100 ranks. No?
#159 by Brooke on February 26, 2014 - 11:58 am
Regional listening preferences? How can this map represent music preferences for a region? You mentioned that you sampled listening preferences for listeners accounts in certain zip codes. You neglected to state what service the people were using to listen to music. How can the users of one site represent the music preferences for entire states? It is one thing if some of the groups were one hit wonders but most do not even amount to that. Its likely over half of the groups have never even been played on the radio and probably never will.
#160 by Paul on February 26, 2014 - 12:20 pm
The study isn’t about finding the favorite artist for a state, it is looking at regional music listening preferences. The map is showing a distinctive artist for a state. The data used is drawn from a wide array of music services.
#161 by Tim on February 26, 2014 - 12:20 pm
The delta you really want here is the delta in log ranks. Without taking logs, you are treating the difference between rank 1120 and 1131 as being bigger than the difference between 1 and 10. When you compare logs, it is more like looking at the % difference. The first two are nearly indistinguishable, whereas the second two are quite different — this will show up nicely in the difference between the logs.
#162 by Paul on February 26, 2014 - 12:22 pm
yep, I’ve been thinking about this. May make another pass in the future around this, as another commenter suggested, not use ranks at all but look at some form of normalized plays.
#163 by sdenton4 on February 26, 2014 - 1:29 pm
Here’s my thoughts on methodology:
It would be better to assign each band a local novelty score, equal to the difference of the listens per capita in state X versus the listens per capita for the entire site (note, this may include international data, but that still says something about novelty within a state!). This gives a ranking of all bands by novelty in each state.
The way of assigning ‘winners’ really shouldn’t depend on any arbitrary ordering of the states. In particular, we need a better way to resolve ties than just giving them to the more populous state. Since the novelty score is a real number, we can almost certainly resolve all ties by giving it to the state with the higher novelty score. In other words, we should find the absolute highest novelty score for any band in any state. We give that band to that state, remove that band and that state from all of our lists, and repeat until each state has a band.
For example, let’s say that Connecticut, Indiana, and Alaska all have Nickleback as their most-novel band, but their novelty scores are 0.56, 1.72, and 1.3 respectively. Then Nickleback should be associated with Indiana. (Sorry, Indy.)
#164 by Paul on February 26, 2014 - 1:47 pm
Another commenter has suggested the Gale-Shapley algorithm to improve the matching. I may try that.
#165 by sdenton4 on February 26, 2014 - 1:44 pm
(I’m also happy to help out with further conversations; feel free to drop me a line: sdenton4 at the usual google webmail.)
#166 by sdenton4 on February 26, 2014 - 4:05 pm
Nice idea with Gale-Shapely. I was thinking of it as an assignment problem (http://en.wikipedia.org/wiki/Assignment_problem), setting up an edge weighting that we wish to maximize with a particular matching. GS will also need some kind of preference function (possibly asymmetric) as a design choice.
#167 by Joe Lawler on February 26, 2014 - 12:26 pm
Maybe I’m just not getting it, but how do the three most populous states end up with their 23rd, 16th and 47th picks? Shouldn’t California end up with its No. 1 pick?
#168 by Read B Forposting on February 26, 2014 - 1:29 pm
You are not getting it.
#169 by Alex Cannon (@acannon828) on February 26, 2014 - 7:24 pm
California does end up with its No. 1 pick, using a depth of 50 and comparing it to the rest of the United States. In other words, only the 50 most popular artists in each state were considered. The most distinctive of these 50 was selected for that state’s artist, where distinctiveness is measured as the difference in popularity ranking between that state’s rankings and rankings for the entire United States.
#170 by Alan on February 26, 2014 - 12:41 pm
Jimmy Buffet is missing – you obviously made a mistake..
#171 by @shamari_feaster on February 26, 2014 - 12:59 pm
Reblogged this on Feaster Javascript Development and commented:
This is a really mix of technology, statistics and music. Not exactly, Deeper History but I wanted to share because I thought it was very interesting.
#172 by laufvergnügen on February 26, 2014 - 1:04 pm
Is the app available to download? If so, what is it called? You might have mentioned it, but I couldn’t find it.
#173 by Paul on February 26, 2014 - 9:14 pm
It is online here: http://static.echonest.com/geo_listening_preferences
#174 by jaypeabea on February 26, 2014 - 1:06 pm
Studies are always fun. You can really play with them in so many ways by altering the data inputs. I think it would help a lot of readers to understand that. (Statistics should be a required class these days, particularly with media and advertisers manipulating statistics to their own desired outcomes.) Your music study is super fun. Thanks for introducing us to some unique music we’ve not yet heard! :)
#175 by Paul on February 26, 2014 - 9:14 pm
thanks for the nice feedback!
#176 by Sean Power on February 26, 2014 - 1:19 pm
Did you happen to have made one of these for the provinces in Canada? Or are you possibly thinking of making one?
#177 by Paul on February 26, 2014 - 1:43 pm
perhaps in the future.
#178 by myaccountability on February 26, 2014 - 1:20 pm
Tn #1 was Hillsong, but Hillsong assigned to SC even tho TN is more populous than SC. Is there some other weighting?
#179 by Paul on February 26, 2014 - 1:44 pm
The depth used for the maps is 50 not 100 like it says on the map legend (I’ve fixed it since). If you look at the TN list you see that at the depth of 50, Juicy J is on top.
#180 by Britt Thorson on February 26, 2014 - 1:25 pm
Hi Paul! I write for Seattlerefined.com and would love to use your above map along with a post about WA’s band. Want to make sure I have photo permissions, and find out who you would like me to credit. Thanks!
Britt Thorson
Assistant Editor
Seattle Refined
206.404.3044
#181 by Paul on February 26, 2014 - 1:41 pm
feel free. Credit goes to me: Paul Lamere
#182 by Stephen Cody on February 26, 2014 - 1:29 pm
It’s amazing by looking at the comments how many people still didn’t understand that this isn’t about the most popular band in a state.Our math and reading comprehension in the US are pathetic.For those of us who understand it tho it was interesting to say the least.I think they’re just mad because we got R.E.M.!
#183 by Read B Forposting on February 26, 2014 - 2:15 pm
Amen.
#184 by John "jaQ" Andrews on February 26, 2014 - 2:30 pm
To be fair, it’s a pretty reasonable assumption if you only look at Vermont.
#185 by Morris on February 26, 2014 - 3:20 pm
I agree that not everyone reads as they should, but to fair, many landed on this page from articles like Business Insider that highlighted this study with the title: “Here’s Every State’s Favorite Band”.
#186 by Paul on February 26, 2014 - 9:17 pm
Ah that’s better, we just have journalists with reading comprehension issues.
#187 by Ian Gustafson on February 26, 2014 - 1:34 pm
Thanks, this is pretty interesting.
For those of you who complain about how you haven’t heard of the band listed for your state, remember this before you decide to take any statistic you read/hear about anything to heart!
#188 by Eddie on February 26, 2014 - 1:58 pm
Hi Paul. Great article and insight into what everyone is listening to. Do you have any plans to continue this research with other countries, or a global look at listening choices?
#189 by Paul on February 26, 2014 - 2:15 pm
I hope to be able to do this for the world sometime in the near future.
#190 by Alf on February 27, 2014 - 5:17 am
Here’s a comparison of artist popularity between various countries (and the whole world) – it would probably work similarly well on a map: http://hublog.hubmed.org/archives/001085.html
#191 by jo momma on February 26, 2014 - 2:03 pm
Texas=Pantera
#192 by English Man in New York on February 26, 2014 - 2:14 pm
James Blake… Sweet!
#193 by alison on February 26, 2014 - 2:16 pm
As others have said here, I’m having trouble grasping the basic building blocks of this, from a research methods standpoint (which means “everything” if you’re claiming to present research findings). You say you’re taken your data from people who “anyone who has an account”, but I haven’t been able to find where you state what kind of account and where/with whom.
Once that is established, my next question is: with these accounts, do people have free reign to listen to any and all music? Or (as I suspect) is it limited only to artists that happen to currently be on ‘rotation’ in a given music service?
Because honestly, from the artists you’ve listed, it seems like your sample has been drawn from a *horrible* selection of music; one that possibly only includes current ‘Top-40’ artists, mixed with ‘old favorites’. Is it possible that people in your sample are only listening to these particular artists because they are all that’s available on that particular streaming service?
A survey of Netflix stats might yield similarly skewed results in that Netflix only includes whatever films are currently being pushed as ‘new-ish’ or re-hashed semi-good stuff that they were able to get the license for. ;-)
And yes, as others have said (in so many words), the act of having selected a particular online music service is itself biasing your sample. It would lead me to ask what types of people use online streaming, if they listen to music in other ways (i.e. in iTunes, or on hardcopy that they’ve purchased, such as cd or vinyl), and which fraction of the population uses that particular service you’ve used for data, too. Because I can see the age/cultural bias already in your results. I don’t mean to sound harsh, but the artists listed led to to believe that this study was from about 10 years ago–which is what made me think about the bias.
Anyway… it’s still a neat idea. It would be all the stronger with tighter research methods. Best regards. :-)
#194 by Paul on February 26, 2014 - 3:12 pm
Thanks for all the feedback and suggestions. Remember, that this is a blog post and not a journal article. As for the source of data, it is aggregated from a number of music streaming services powered by The Echo Nest. For these accounts, people have the ability to listen to any artist or track in the catalog on demand. Catalogs are on the order of 20 or 30 million tracks, with nearly all music (except for notable exceptions from digitally-shy artists like The Beatles). As for other biases, I’m sure there are some, but we do the best we can with the data we have. Previous posts discuss age and gender distribution. The most frequently occurring age for a listener in the data is 21.
#195 by FL Resident on February 26, 2014 - 2:17 pm
Who the hell is Rick Ross?
#196 by Chido Wan on February 26, 2014 - 3:14 pm
Once you see him, he’ll be the biggest boss that you will have ever seen, thus far.
#197 by beowulf888 (@beowulf888) on February 26, 2014 - 2:18 pm
Interesting study. But I question whether I’d want to subscribe to any music service that would recommend Bonobo to me, just because I live in California. I listen to a lot of different genres, but I don’t listen *by genre* or by artist. I shuffle 15K songs — without any preference to genre — on my iPod. While I listen to huge variety of music, there are genres that I don’t go near — death metal, electronic, classical music from the Romantic period, Vietnamese pop music, etc. I’m still looking for a streaming service that randomize my listening across genres I’m interested, but also present me with new music I’m interested in. So far, I haven’t found a service that can do this.
#198 by whitebox on February 26, 2014 - 8:02 pm
Sound Cloud, Groove Shark.
#199 by Paul on February 26, 2014 - 9:20 pm
We won’t recommend Bonobo because you live in California. That’s not the point of the study.
#200 by spon on February 26, 2014 - 2:28 pm
Hi there
Your study has been reposted on a French website except they didn’t get the idea at all.
They just posted your map as USA’s favourite bands per state, and made their own stupid analysis.
I felt the need to tell you. This kind of misinterpretation just pisses me off.
link :
http://www.konbini.com/fr/tendances-2/carte-artistes-americains/
(this website is quite popular and its articles are reposted a lot)
Cheers
Roman
#201 by Paul on February 26, 2014 - 2:31 pm
thanks Roman. Same has been happening here as well.
#202 by John "jaQ" Andrews on February 26, 2014 - 2:28 pm
So, how does it feel to have your work so thoroughly misrepresented by the press?
#203 by Paul on February 26, 2014 - 9:21 pm
A tad frustrating, but I think I bear some of the responsibility. Whenever you put out a map with a single artist label on each state you are asking for trouble.
#204 by Pia on February 26, 2014 - 2:28 pm
How do you define listener? What source do you draw your data from? Pandora? ASCAP? Radio listening surveys? iTune sales? Without this context, this data is meaningless. For instance, if it’s drawn from a music subscription service, obviously the popularity of the service and the demographics of its subscribers are very important in creating an overall picture.
This post seems to make really broad generalizations without citation.
#205 by Paul on February 26, 2014 - 2:43 pm
For this study, I sampled the listening preferences of about a quarter million listeners that have a zip code associated with their account. These are listeners that subscribe to music streaming services. These particular blog post is in a series of blog posts. I’ve talked about the data sources in other posts. Note though that this is a blog post, not a scientific paper that I’m submitting for publication. There are no citations because its a blog post.
#206 by Pia on February 26, 2014 - 2:57 pm
Thanks for the information. Since this is being widely shared, independently of previous posts, it couldn’t hurt to add a quick definition of “listener” in, or close to your lead paragraph. Without the context, this post leaves itself wide open to misinterpretation (as is made clear by a lot of the responses).
#207 by Paul on February 26, 2014 - 2:58 pm
Good suggestion.
#208 by Pia on February 26, 2014 - 3:01 pm
Also, I do think it’s rather a big leap to project the listening preferences of music service subscribers to everyone who listens to music. It would be interesting to see ratio of music subscribers to the overall population.
#209 by Paul on February 26, 2014 - 3:05 pm
I’ve discussed this in some other comments. Indeed, the reliance on this kind of music data skews the results. These types of listeners tend to be more musically engaged and more wealthy than the average listener. However, one can only use the data that one has.
#210 by Pia on February 26, 2014 - 3:17 pm
Do you have figures that music listeners are “more musically engaged and more wealthy than the average listener?” Or, is that an educated guess? What about people over the age of 40 or 50? They may have lots of money, and yet comprise a much lower percentage of subscribers of music services. On the engagement side of the equation, I come from New Orleans, which is a music-obsessed city, yet has one of the highest poverty rates and almost the lowest level of Internet access in the country.
In any case, again, sorry to pile on. This is an interesting thing you’re doing, but IMO, by not explicitly defining your terms and the parameters of what you’re looking at, you’re undermining the value of your research.
#211 by The Unconventional Blogger on February 26, 2014 - 2:49 pm
Reblogged this on katiejayne94 and commented:
What I have to look forward to when I go to NYC next year :D
#212 by Peter Rigano (@petehume) on February 26, 2014 - 3:09 pm
Have you considered looking at the tf-idf weighting, which takes into account relative frequency and not just relative rank?
http://en.wikipedia.org/wiki/Tf-idf
tf-idf is usually used to rank the frequency of words in a document relative to the frequency of those words in an entire collection (corpus) of documents. Many search engines use this approach to compare documents to a query. In this case, if you consider each state a document in a corpus, and each artist a word in that document, you can compute tf-idf weights for each (state,artist) tuple. Within each state, the artist with the highest tf-idf weight would be the most “distinctive” artist to that state. Note, that this approach does not guarantee mutual exclusivity.
Gale-Shapley would give mutually-exclusive answers, but does not account for differences in intensity between different ranks. That is, with G-S the difference between rank 4 and 5 is the same as the difference between rank 100 and 101. However, it’s likely that the difference in raw-frequency is quite different in those two cases. This is due to the fact that ranked data generally follows a power-law, rather than uniform distribution (http://en.wikipedia.org/wiki/Rank-size_distribution). I’d imagine that in practice, Gale-Shapely would produce a seemingly-arbitrary assignment of the overall top 50 artists, but maybe not – I’d be interested to see how that works.
#213 by Paul on February 26, 2014 - 3:32 pm
yes, I’ve considered TF-IDF weighting, and will probably try it at some point. The challenge with TF-IDF is finding the right cutoff, artists with very few listeners can rise to the top with TF-IDF. I went with the simple change of rank approach because (a) it was easy to explain to non-IR types, (b) it gave useful results across a range of popularity (by adjusting the depth), and (c) it was easy to implement when on a 12 hour airplane ride with no access to wifi.
#214 by jpfed on February 27, 2014 - 9:31 am
Yeah, I kinda regret having mentioned Gale-Shapley. I believe your intuition would be borne out: we would mostly just get the top 50, with California getting the top artist and Wyoming getting number 50. There are a few states whose top 50 is different from the top 50 of the nation as a whole, so they would show something interesting.
#215 by RustyAlaskan on February 26, 2014 - 4:29 pm
I live in Alaska. Who the hell is Ginger Kwon?
#216 by Tabitha on February 26, 2014 - 5:39 pm
Uhhhh epic fail on your part dude
#217 by Paul on February 26, 2014 - 9:00 pm
why’s that?
#218 by Callie on February 26, 2014 - 6:40 pm
An interesting followup would be the same map colored to indicate the most musically mainstream (boring) states is states where the difference is the smallest.
#219 by Paul on February 26, 2014 - 9:00 pm
someone on twitter is working on such a map
#220 by whitebox on February 26, 2014 - 7:40 pm
Who’s Ginger Kwan?
#221 by whitebox on February 26, 2014 - 7:58 pm
So if PA has the smallest differential that means that is the “trendiest” or most mainstream. Where as AK with the highest differential has the most isolated tastes.. That makes sense.
#222 by whitebox on February 26, 2014 - 8:00 pm
At least among digital music users.
#223 by whitebox on February 26, 2014 - 8:37 pm
But I think HI won this round…
#224 by jmmgarza on February 26, 2014 - 8:22 pm
I would be more interested in market segmentation broken down by education, state, region, age, sex and ethnicity.
#225 by nmasonslc@gmail.com on February 26, 2014 - 8:31 pm
What ever this represents it is misleading and kind of irrelevant since so many of these bands aren’t known by most people reading this. Your response may be that we aren’t understanding the study, but if most people don’t understand the study then you have a problem. I really doubt that this map represents the listening preference of any region. What does that even mean?
#226 by Paul on February 26, 2014 - 8:55 pm
Did you read the blog post? I try to explain the data in the blog post. If you read it and don’t understand it, then I agree, it is my problem. If you didn’t read it, and you don’t understand it, then it’s your problem.
#227 by PsiCop on February 26, 2014 - 11:33 pm
I’m from Connecticut, but have never once heard of “David Guetta,” whoever (or whatever) that is. The name has never once come up in conversation here. I’ve never seen it in a playlist anywhere. Springsteen being popular in Jersey, I buy … but “David Guetta” being popular in the Nutmeg State … not so much.
#228 by Spmarx on February 26, 2014 - 11:57 pm
Paul, thanks for this. It has ZERO relevance in my life and it’s still a sincere thank you. What I’ve found most interesting is the comment stream, and as B.Mac said above (or below, I’m not sure). A) By and large it’s a respectful curious, and intelligent group and B) Even having said that, several have made me yell at my screen. You’ve handled them all respectfully and with aplomb.
In my world your map need not be ‘right’, ‘perfect’, ‘applicable to anything in my daily life that feeds my kids and pays my mortgage’. (In truth, it only needs to be those things in your world I suppose…) What I like the most is, I’m not skeptical because you aren’t selling me something. Anything. You are presenting data clearly for its geeky POI sake…and you reeled me in. Well done.
Of course you know that every state is going to skew in the next week as people here in CO start typing “The Naked and Famous” into Spotify…like I’m doing now…). Good way to track the new data, show how you influence trends, and ask for a raise huh? :)
#229 by Ivana Nosic on February 26, 2014 - 11:57 pm
Would love to see what canada looks like!
#230 by Derek Wilson on February 27, 2014 - 12:03 am
Who the hell are “The Civil Wars”???
#231 by Derek Wilson on February 27, 2014 - 12:08 am
Very interesting is that NOT a single artist was popular in more than one state.
#232 by jpfed on February 27, 2014 - 9:25 am
It’s an intentional part of how the map was constructed; once an artist is assigned to one state, it is not used for another state.
#233 by THE WITHERS on February 27, 2014 - 12:35 am
California should say “THE WITHERS”-nobody’s heard of Bonobo or whatever. People in CA listen to punk rock- good punk rock like THE WITHERS.
#234 by Jim on February 27, 2014 - 12:53 am
Kelly Rowland in Maryland? Really? Really?
#235 by David Herbert on February 27, 2014 - 1:18 am
Is there a way to see the nation’s average responses? What is the collective US listening to?
#236 by indianskiier on February 27, 2014 - 1:21 am
interesting how many of these artists are hometown (err…state) based…I just skimmed, but saw Springsteen for Jersey (Asbury Park); DMB for VA (Charlottesville); Phish for VT (Burlington), etc.
#237 by Homemade Jam on February 27, 2014 - 6:12 am
Id be interested to see what result you get using %of sample size rather than ranking. It might throw up some more mainstream names that people can relate to.
#238 by Paul on February 27, 2014 - 8:51 am
Yes, on my list of things to try. Thanks!
#239 by Bob Wilbert on February 27, 2014 - 6:19 am
I’m curious as to the details of this “study”. I find it difficult to believe that EVERY state has a different artist as their number one.
#240 by Paul on February 27, 2014 - 8:50 am
Bob, read the post for the details. It explains why every state has a different artist.
#241 by Brian on February 28, 2014 - 1:19 am
Right, the map shows each state’s most distinctive artist relative to all other states thus the different artists and sometimes maybe more obscure artists. I would like to see each state’s most popular artist to really know what each state listens to most, even if many states would possibly have the same artist!
#242 by Paul on February 28, 2014 - 8:20 am
Check out the post Favorite Artists vs Distinctive Artists by State for a map of the most popular artists by state.
#243 by Jim Rhinehart on February 27, 2014 - 10:52 am
You don’t know squat Luke Bryan is the hottest artist in the country.
#244 by Greyson on February 27, 2014 - 12:28 pm
Awesome study and think you’re spot on with the methodology. Did you only look at the deltas for the top 50 artists in the state or is that just a coincidence? Thanks!
#245 by Paul on February 28, 2014 - 8:42 am
You can look at top-N artists at depth up to the top 1000 artists. Try it here.
#246 by Max B on February 27, 2014 - 12:47 pm
No DC! More people than Vermont and Wyoming but still no respect! Sigh.
#247 by Paul on February 27, 2014 - 2:43 pm
I made some new maps, and I include DC on them.
#248 by Alan on February 27, 2014 - 2:03 pm
What exactly are “music streaming services that are powered by The Echo Nest”? This actually seems like a pretty lame excuse for a representative sample.
#249 by T on February 27, 2014 - 4:55 pm
I live in FL who the heck is Rick Ross?
#250 by V on February 27, 2014 - 11:52 pm
Sadly, the state I’m from has one of maybe the three artists on this map I don’t know! Maybe it’s because I’m from the city and the rest of the state is fairly suburban/rural?
#251 by chuck on February 28, 2014 - 7:46 am
I’m from Boston and I have absolutely no idea who Neil Young is. He obviously never appeared on Broadway.
#252 by Max on February 28, 2014 - 10:16 am
Who is James Blake?
#253 by HipsterApproved.net on February 28, 2014 - 11:24 am
That’s why God created Google.
#254 by HipsterApproved.net on February 28, 2014 - 11:21 am
Reblogged this on HipsterApproved.net and commented:
Cool…I see there are a few ‘hipster’ bands still liked here in the U.S.
Sufjan Stevens, Edward Sharpe, The Shins…
#255 by HipsterApproved.net on February 28, 2014 - 11:23 am
Wow…very interesting.
I’m going to have to look into some of these bands…
#256 by dilmarrodrigues11 on February 28, 2014 - 7:21 pm
Reblogged this on dilmarrodrigues11.
#257 by Versatile Creations BY: Josie on February 28, 2014 - 8:14 pm
Very interesting. I can say after traveling, it is amazing how many times I hear people say oh why travel it’s the same everywhere. Well this adds to my response that geography, age, sex and financial status makes a big difference in almost everything. I was in TX now AZ and there is a big difference on the music tastes, past time recreation and personality traits. Very neat program.
#258 by Shayne on February 28, 2014 - 8:54 pm
I’m Alaskan. Who the heck is Ginger Kwan?
#259 by beebrock86 on February 28, 2014 - 10:40 pm
Being from Kentucky, I don’t know anyone that listens to Fall Out Boy. I do find data like this very interesting though.
#260 by summerpena03 on February 28, 2014 - 10:49 pm
You, my friend, are awesome. Thanks for the post!
#261 by pezcita on February 28, 2014 - 11:11 pm
Fascinating. I’m from Illinois (now a.k.a Suljen Stevens), and all I’ve heard is that once you cross over into Indiana, it’s all country stations.
#262 by Disappointed on March 1, 2014 - 12:01 am
I thoroughly appreciate the unique data you’ve gathered and presented here. I am so very sorry that after all the work you’ve put in, people reading this believe that because they’ve not been exposed to a particular artist listed, you are wrong, or at the very least, responsible for educating them. I hope the incredibly ignorant responses I’ve just read on here do not discourage you from additional collections and interpretations of data as you’ve done with this. I know I personally, and those I’ve just sent this to, certainly enjoy such unique finds!
#263 by Laxman Prajapati on March 1, 2014 - 12:27 am
Really very interesting … :)
#264 by leftbraintendencies on March 1, 2014 - 12:52 am
Thanks Paul! I agree with a comment made earlier, you are very patient with people and explain yourself, beautifully!
I live in Colorado and love naked and famous. I think it is accurate for my state because my ringtone is one of their songs, when my phone is singing people say,”great song”. Shauna
#265 by Duder NME on March 1, 2014 - 1:07 am
Young Jeezy? FEH. Jerry Goldsmith forever!!
#266 by wyattanton on March 1, 2014 - 7:01 am
Very interesting research. My hat is off to you. Also, I’m interested to see what the Canadian maps looks like.
#267 by awax1217 on March 1, 2014 - 7:54 am
A really interesting take. I noted it when we went cross country. Some areas had music on the radio which was country songs after country songs. Jazz was unheard of . Classical might not have existed. No one plays the classics. Never thought too much about it.
#268 by Waiting for better info. on March 1, 2014 - 12:41 pm
Did you consider listening to a different station? Most stations play different genre’s. I too have traveled cross country, and one thing held true; Jazz, Sports, Rock, Hits, Country, News, Comedy were all present.. Next time change the station.
#269 by The Sandwich Lady on March 1, 2014 - 8:49 am
This is one of the coolest and most intriguing posts I’ve read in a long time. So glad our state (MA) is associated with the godfather of grunge.
#270 by Y.O.P.J. on March 1, 2014 - 10:57 am
Reblogged this on Cre8ive Studios and commented:
A very interesting view. Hope we see such data for other parts of the world. Or do I ?
#271 by kkessler833 on March 1, 2014 - 11:33 am
Very interesting blog. I am a David Garret fan myself. I have his CDs and I love to listen to his Youtube videos. The 2010 concert in Germany is especially good!
#272 by trcapromo on March 1, 2014 - 11:59 am
very interesting
#273 by mattski1208 on March 1, 2014 - 12:40 pm
very interesting. music and advertising may find this useful in product promotions.
#274 by emmerzlife on March 1, 2014 - 7:00 pm
Reblogged this on emmerzlife and commented:
One country, different preferences?
#275 by cmachadolearns on March 1, 2014 - 7:44 pm
Reblogged this on cmachadolearns.
#276 by djshelf on March 1, 2014 - 7:45 pm
Not sure how valid any of this data is, but thank you for confirming that, no matter where they reside, the average American has horrendous tastes in music.
#277 by Laura Liz Monroe on March 1, 2014 - 7:48 pm
Awesome! I’m from Alabama, and we definitely listen to the Civil Wars.
#278 by The Childlike Author on March 1, 2014 - 10:58 pm
Yeah! I’m from Missouri! Go The Shins!
Who are they, by the way?
#279 by andrea valeri on March 2, 2014 - 2:44 am
Reblogged this on Il Diario di Bordo.
#280 by juba211 on March 2, 2014 - 4:40 am
Reblogged this on jubamusicent and commented:
Take A Look
#281 by Sandy on March 2, 2014 - 7:41 am
Wish there’s a global infographic but I guess that would take a huge amount of data. I’m from sunny Philippines where ballad reigns and I hate it sooo much! For years I was trying to like music that I didn’t care about. I love metal and rock and rooted for Phil Phillip not Jessica Sanchez on AI and that placed me squarely in the 2 % (wild guess but I think its fairly accurate from where I ccome from)
#282 by Tim McCreight on March 2, 2014 - 8:56 am
Pretty neat and glad I stopped by to read. I can’t help wonder, though, if the data are in part reflecting an intersection of technology use and demography. In your TN/NE comparison mostly every name on the TN list is a more recently established artist while the NE lists skews to artists whose greatest popularity was 20 years or more ago. The most popular artist by state confirms this for 5 of the 6 New England states. That suggests the data draw from different user pools that, as a matter of course, would exhibit different listening preferences. And NE as a whole skews older than the SE. Is it possible to control for use of the services by age?
#283 by OdesIsPro on March 2, 2014 - 10:48 am
Very nicely put together. I have been looking at something similar regarding visual art this is actually helpful. Thanks!
#284 by john on March 2, 2014 - 11:41 am
hey you fool i read your actical and ask 2000 people and none of them knew who the hell kurt vile was so you wrong get a real job fool
#285 by Up in the Air on March 2, 2014 - 2:55 pm
Maybe you should work on how cultured you are…just a thought! I thought this was interesting, I’ve lived in 10 or so states, and of all of these I’d probably disagree with ND and MN.
#286 by sirbangfk on March 2, 2014 - 1:21 pm
Reblogged this on sirbangfk's Blog and commented:
I like this it helps me to see wat artist are good to try and work with..
#287 by mommyx4boys on March 2, 2014 - 3:27 pm
i live in va and am pretty surprised its dave mathews band i would have guessed jason aldean or someone similar
#288 by torath69 on March 2, 2014 - 10:21 pm
Kurt Vile for Oregon? I think you have it wrong.
#289 by Droppin' Knowledge on March 3, 2014 - 12:16 pm
This was very interesting. Even individual genre’s have different regional styles, especially more noticeable in hip-hop and EDM.
#290 by healthaddict00 on March 3, 2014 - 12:30 pm
I’m a Minnesotan and don’t know what Metric is. I feel pretty out of the loop so to say. haha. I shouldn’t be a Minnesotan.
#291 by Hopewell on March 4, 2014 - 7:49 am
I’ve absolutely got to share this with my son in law, who is Worship Director at my church. We live in New England. Thank you for sharing – very interesting!
#292 by photostories2013 on March 6, 2014 - 12:40 am
This is awesome, brilliant. thank you, talking about human behavior and culture through music.
#293 by bflydesign on March 6, 2014 - 2:15 am
Reblogged this on bflydesign and commented:
Shout out for Arkansas
#294 by m0nkeymike69 on March 6, 2014 - 2:32 pm
Wow, this is awesome! As an aspiring musician it helps to know where my music might have a better shot at popularity. Thanks for this!
#295 by Jonny Dockett on March 8, 2014 - 10:02 am
Loved this, great stuff!
#296 by Sean on March 8, 2014 - 3:23 pm
Is there an iPhone or Android app for “Regionalisms in U.S. Listening Preferences”? Thanks.
#297 by rebeccaloubro on March 9, 2014 - 11:20 pm
Reblogged this on Rebecca Broughton and commented:
Nice bit of audio streaming data collected in the USA. Lovely to see Bonobo and The XX included! :)
#298 by Emma Preston on March 15, 2014 - 4:56 pm
Just a note about a minor error in your app: when I click the Mountain setting in the dropdown menu, it tells me “Mountain includes ID MT WY NV UT CO AR NM”
AR means Arkansas. AZ means Arizona.
On another note, I can’t decide if I feel ashamed that my home state gets Linkin Park for “most distinctive”. I like to think that we have enough of a distinctive culture that we would get something further off the mainstream charts than that.
#299 by George Fertakis on March 19, 2014 - 4:19 am
Reblogged this on Against The Grain.
#300 by incaunipocrit on March 19, 2014 - 1:03 pm
Reblogged this on The International Blogspaper.
#301 by Ben on March 20, 2014 - 10:11 am
This is so interesting! Also, after reading some of the posts, I’ve decided that Paul is the most patient person in the world. Paul – I suppose the top 100 artists for a particular state is private data, or can I find it somewhere?
#302 by iamjaneo on March 20, 2014 - 9:44 pm
I am from OK.. ..despise country and will only listen to ROCK. ….don’t know most current. “Music” as I think it lacks talent. ….just my opinion and I may be wrong